USD/ZAR Slides Back Below 18.59s As Fed Chair Signals More Rate Hikes, SA's Load Shedding Hampers Growth In Q4


- USD/ZAR rebounds from the 18.64008 level during the early Asian trading session and snaps a two-day winning streak
- Powell signals more rate hikes are coming in his testimony at the joint Economic Committee, which in turn triggers the U.S. treasury bond yields to rise higher, which in turn underpins the greenback
- South Africa's GDP falls below pre-pandemic levels according to the latest StatSA data, in turn, sees the ZAR tumble and weaken significantly

USD/ZAR pair seesawed between tepid minor gains and minor losses during the early part of the Asian session. The cross struggled to capitalize on extending the modest pullback from the vicinity of the 18.08253 level and ran out of steam after attracting fresh selling in the last hour or so on Wednesday. As per press time, the shared currency has snapped a two-day winning streak and is poised to extend the corrective decline in the coming sessions.
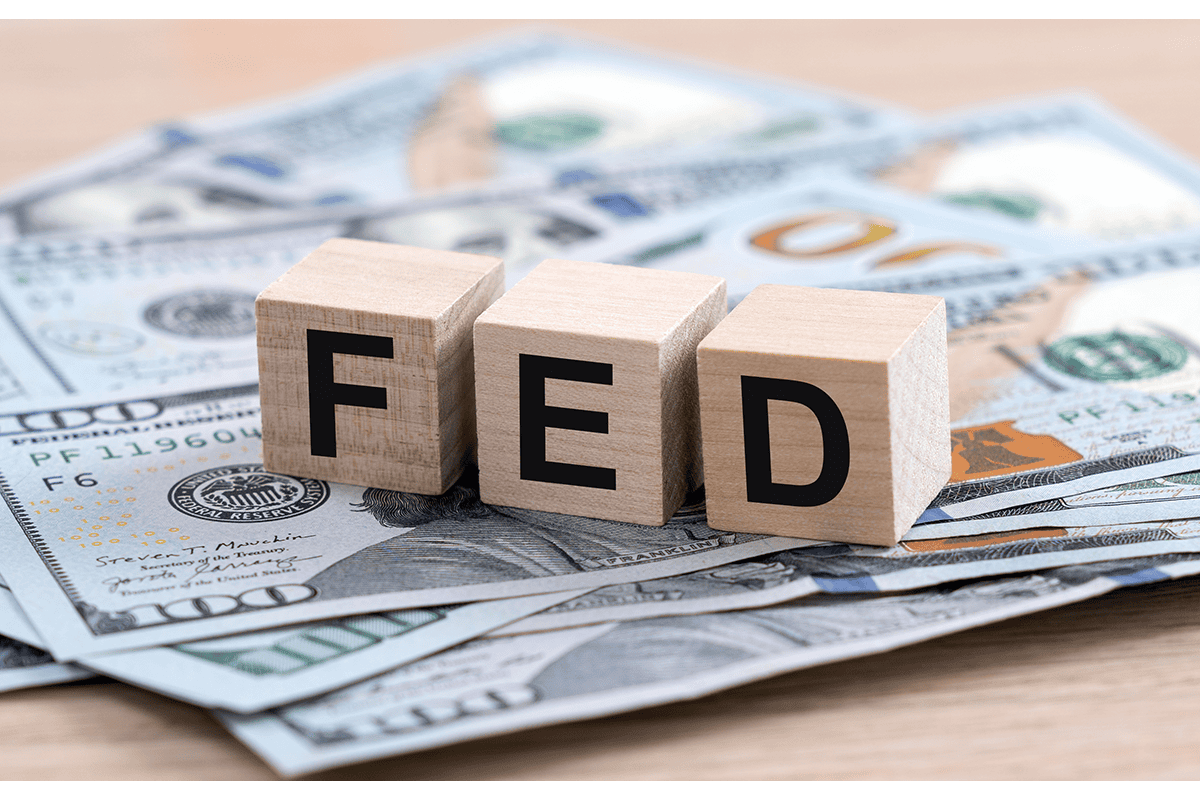
Rising treasury bond yields were bolstered by hawkish comments by the Fed Chairman yesterday during an appearance before the Joint Economic Committee in Washington DC, where he testified on the economic outlook. Recent monetary policy actions underpinned the greenback and helped exert upward pressure on the USD/ZAR pair. A negative sentiment surrounding the U.S. equity markets was also seen as underpinning the greenback. Furthermore, fears of a potential recession in 2023 saw investors pivot into the dollar and treasury yields, which helped exert upward pressure on the USD/ZAR pair.
The U.S. Dollar index (DXY), which measures the value of the United States dollar relative to a basket of foreign currencies, hit a three-month month high on Tuesday after Federal Reserve Chair Jerome Powell said the U.S. central bank is likely to raise rates more than previously expected and warned that the process of getting inflation back to 2% has "a long way to go."
"The latest economic data have come in stronger than expected, which suggests that the ultimate level of interest rates is likely to be higher than previously anticipated," Powell said in remarks prepared for two appearances this week on Capitol Hill. "If the totality of the data were to indicate that faster tightening is warranted, we would be prepared to increase the pace of rate hikes. Restoring price stability will likely require that we maintain a restrictive stance of monetary policy for some time," Powell added. Powell went on further to say. "We continue to anticipate that ongoing increases in the target range for the federal funds rate will be appropriate in order to attain a stance of monetary policy that is sufficiently restrictive to return inflation to 2 percent over time. In addition, we are continuing the process of significantly reducing the size of our balance sheet".

That said, CME's Fed Watch Tool is now showing Fed funds futures traders are now pricing in a 73.5% probability that the Fed will hike rates by 50 basis points, lifting the overall Target Rate to 5.25% in the next monetary policy meeting slated for 22nd March.
The latest interest rate forecast by Fed funds futures traders comes days after as a leading indicator for this week's payrolls for February, further indicating that the U.S. labor market remains resilient, hence cementing market expectations that the Fed will stick to high-interest rates to tame inflation in the U.S. Additionally, in recent weeks, Fed officials have also hinted that rates could go higher still and remain elevated for longer. That came after a slew of current data from the world's largest economy pointed to a still-tight labor market, sticky inflation, robust retail sales growth, and higher monthly producer prices.
Shifting to the South African docket, Statistics South Africa's official data on Tuesday showed South Africa's GDP contracted more than expected and fell below Pre-Pandemic levels. The South African GDP shrank by 1.3% on quarter in the three months to December of 2022, compared to market expectations of a 0.4% fall following an upwardly revised 1.8% rise in the prior quarter. It was the sharpest contraction since the third quarter of 2021, primarily due to a sharp increase in power blackouts in recent months. The "GDP fell below pre-pandemic levels." The national statistics agency StatSA confirmed.

South Africa's recent power crisis unsurprisingly drove the slump in growth. Regular rolling blackouts (Load Shedding) cost the local economy millions in lost activity. This marks the sharpest downturn in growth since Q3 2021. When deadly riots rocked the country and caused billions in damage.
As we advance, investors look forward to the U.S. docket featuring the release of the U.S. Trade Balance seen lower at -68.90 Billion, down from -67.40 Billion. Investors will look for cues from the release of the U.S. Jolts Job Openings (Jan), which is lower at 10.500 Million, down from 11.012 Million. The main focus, however, remains on the Fed Chair's comments as he continues to testify before the Joint Economic Committee in Washington DC.

Technical Outlook: Four-Hours USD/ZAR Price Chart
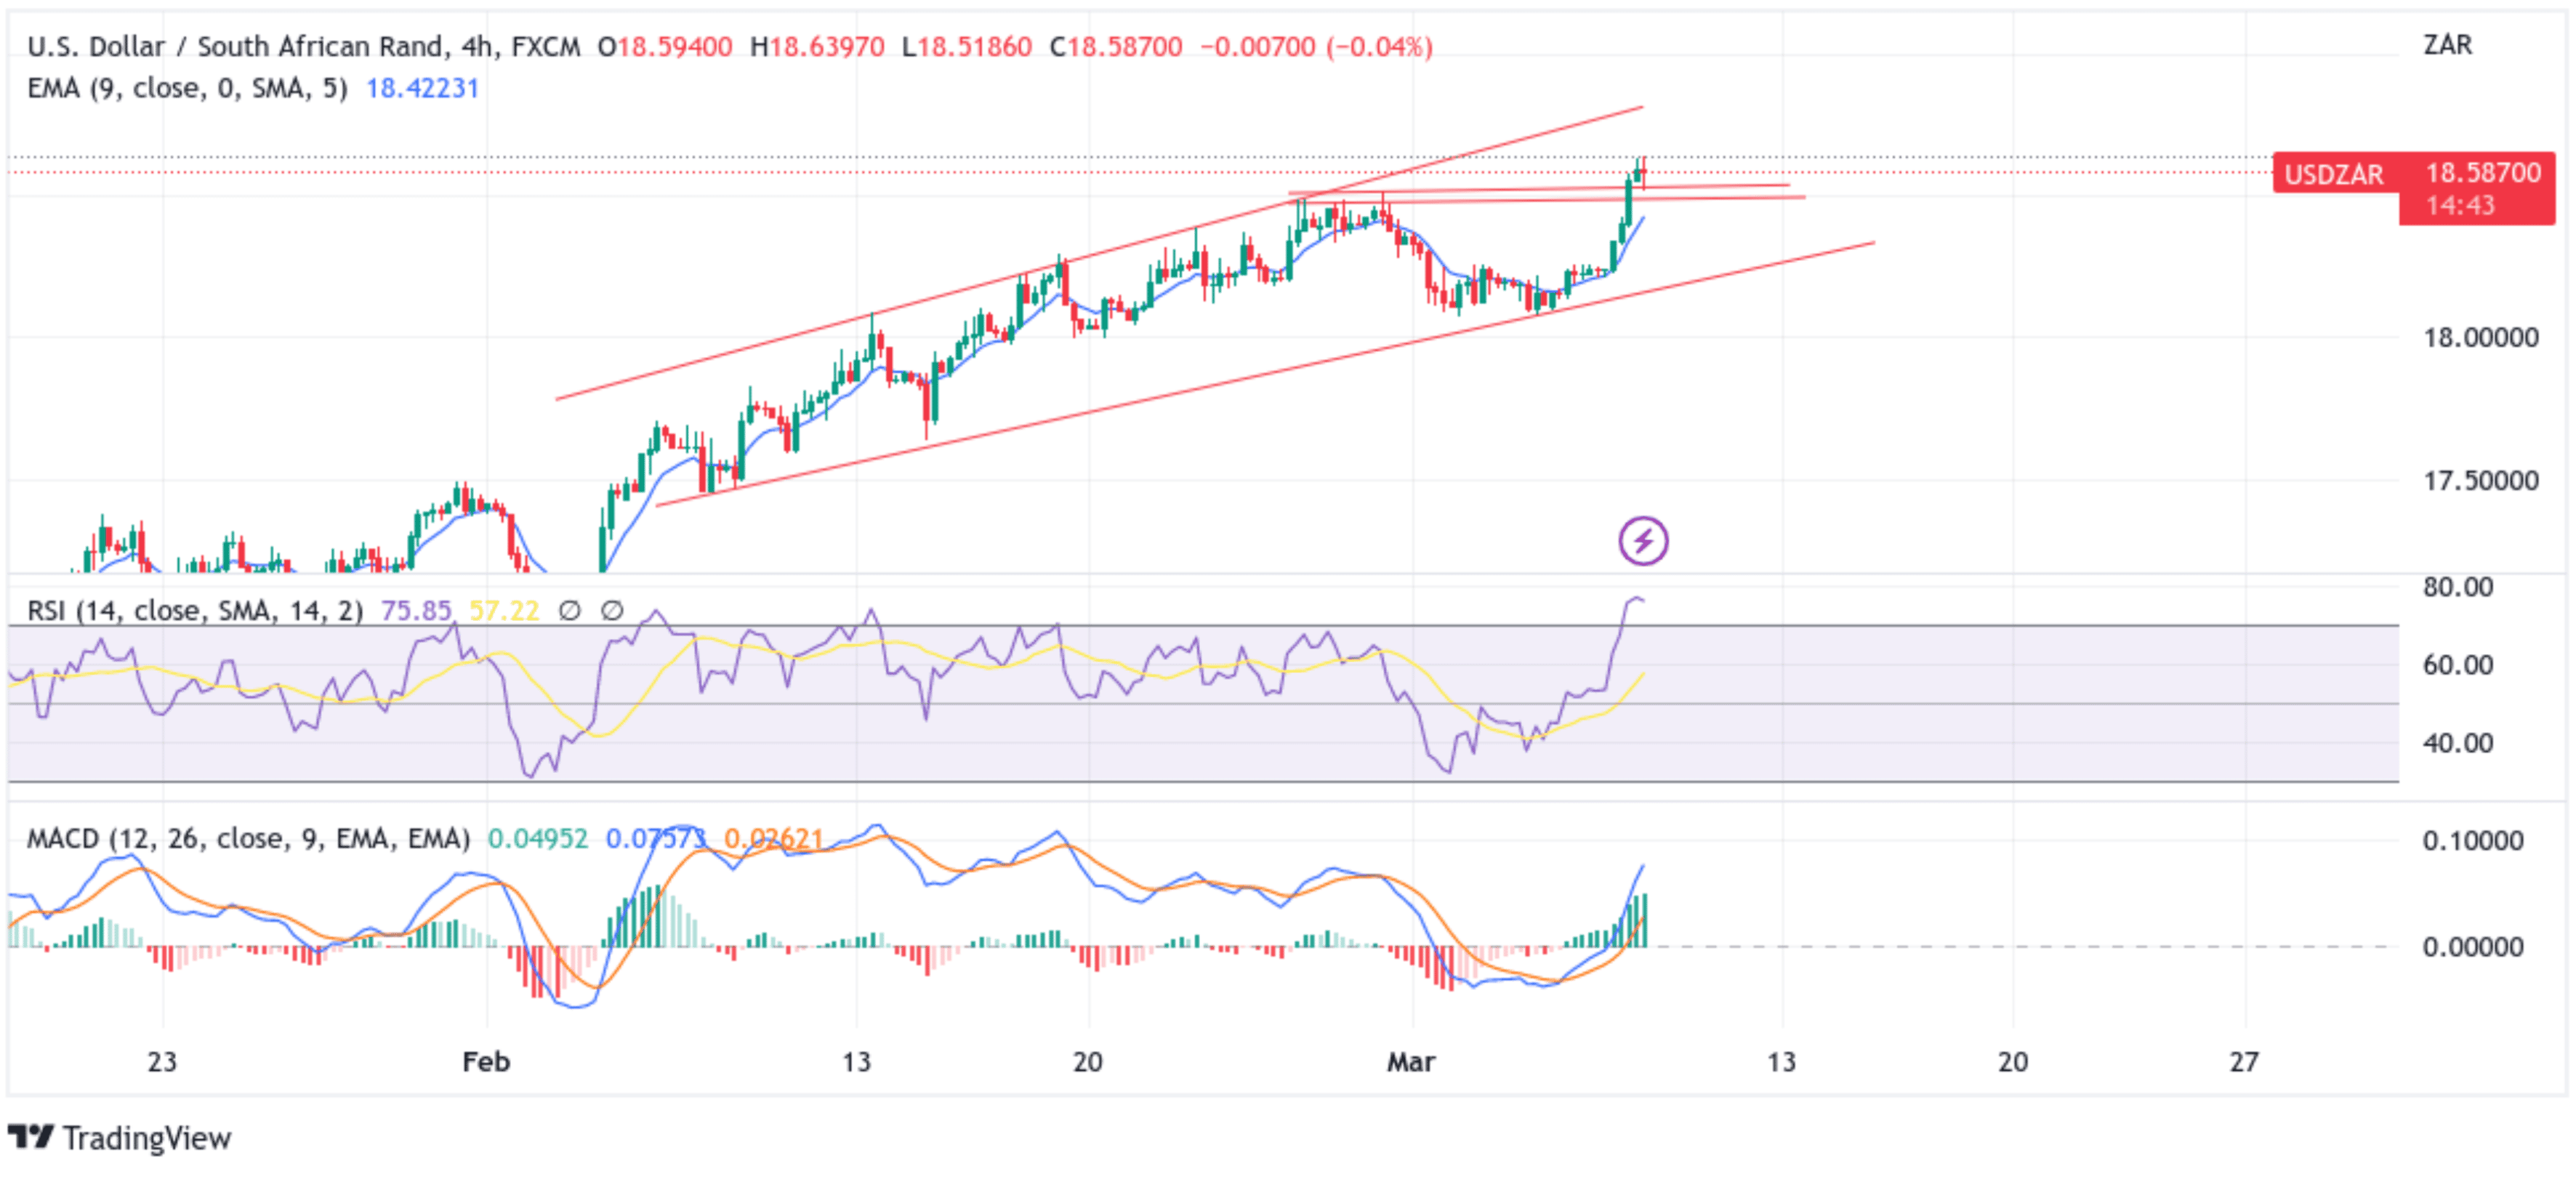
From a technical standstill using a four-hour price, the price rebounded near the 18.64008 level after a strong bullish trajectory that saw prices break above the supply zone ranging from 18.481 - 18.514 levels. Price attempted to break below the aforementioned zone earlier in the session but quickly rebounded. If the price retraces toward the supply zone in the coming sessions and convincingly breaks below it, it would pave the way for technical selling around the USD/ZAR pair.
All the technical Oscillators on the chart hold bullish dip territory, with the RSI (14) at 75.85 and the Moving Average Convergence Divergence (MACD) Crossover all above the signal line. The RSI (14), however, is flashing overbought conditions, warranting caution to traders against submitting aggressive bids. Acceptance of price above the 9 Exponential Moving Average (EMA) at the 18.46163 level adds credence to the bullish bias.
Suppose dip-buyers and technical traders jump in and trigger a bullish turnaround. In that case, the price will face resistance at a key support level plotted by an ascending trendline extending from the Mid-February 2023 swing high. Sustained strength above this barrier would pave the way for aggressive technical buying around the USD/ZAR pair.
