S&P 500 Futures Index Extend Losses Below $4080.0 Level As Inflation Data, Fed Comments Worry Investors


- S&P 500 Futures attracted some selling on Friday to extend the sharp pullback from the $4174.4 level
- U.S. Producer orices rise the most in 7 Months, further adding to inflation worries in the U.S. as ttop Fed Officials stick to the hawkish tone
- Tesla Recalls 362,000 Electric Vehicles
- Cisco beats earnings and revenue estimates, boosts full-year guidance

The S&P 500 futures extended the sharp pullback from the $4174.4 level/weekly high and witnessed selling for the second day on Friday. This also marked the third day of a negative move in the previous five and dragged spot prices to over a two-week low or just below the $4080.0 level amid concerns of stubbornly high inflation metrics. The sharp declines came after January's producer price index, an inflation metric that tracks wholesale prices, rose 0.7% month-over-month in January of 2023, the most in seven months and higher than market forecasts of 0.4%, according to a report released on Thursday by the U.S. Bureau of Labor Statistics (BLS).
In another report released on Thursday by the U.S. Bureau of Labor Statistics (BLS), the number of Americans filing for unemployment benefits had declined to 194 thousand in the week ending Feb. 11, down from the previous week's revised level of 195 thousand and below market expectations of 200 thousand. The latest value remained close to a nine-month low of 183 thousand hits at the end of January, suggesting the U.S. labor market was still tight due in part to reduced labor force participation.
Further undermining the futures index were the hawkish comments from St. Louis Federal Reserve President James Bullard on Thursday afternoon. He said he backed a 50 basis point interest rate hike at the central bank's previous meeting and would not rule out a rate increase of that magnitude at the March meeting. His comments, in turn, triggered the treasury bond yields to rise higher, which was seen supporting the greenback and further adding downward pressure on the future index. The data reports from the U.S. Bureau of Labor Statistics (BLS) came days after the US CPI data and retail sales data all beat market expectations signalling that inflation is still sticky in the U.S. and that the FED policies are there to stay. Markets seem convinced the Federal Reserve (Fed) will stick to its hawkish stance, with CME's Fed watch tool now showing traders are betting heavily that the Fed will raise rates by a quarter of a percentage point at each of its meetings in March and May.
Commenting on the current mood around equity markets, "I think the equity market is listening to data about the concurrent consumer — that there's retail spending that bounced back, that consumer confidence bounced back, and that services PMI bounced out of contraction. There are things to be happy about — the labor market is still tight," SoFi's head of investment strategy, Liz Young said on CNBC's "Closing Bell: Overtime."
Tesla Recalls 362,000 Electric Vehicles
Tesla (NASDAQ: TSLA) gave up gains to trade more than 1% lower after the electric vehicle maker recalled 362,000 EVs equipped with its "Full Self Driving" software, which may cause vehicles "to act unsafe around intersections," according to the National Highway Traffic Safety Administration.

News of the recall offset earlier positive news that Tesla had sold out its Model Y EVs in the U.S. for this quarter as recent price cuts spurred demand.
Cisco beats earnings and revenue estimates, boosts full-year guidance
On the earnings front, according to a CNBC.com news report, Cisco (NASDAQ: CSCO) reported better-than-expected fiscal second-quarter results on Wednesday and lifted its forecast for the full year. Shares of the computer networking company initially jumped in extended trading before paring most of their gains.
Here's how the company did:
- Earnings: 88 cents per share, adjusted, vs 86 cents per share as expected by analysts, according to Refinitiv.
- Revenue: $13.59 billion vs $13.43 billion as expected by analysts, according to Refinitiv.
According to a statement, Cisco's total revenue grew 7% year over year in the quarter ending Jan. 28 Net income fell about 7% to $2.77 billion.
As we advance, In the S&P 500 Index, the best-performing sector on Friday was the Discretionary consumer sector, led by West Pharmaceutical Services Inc (NYSE: WST), which rose 14.54%/40.59 points to trade at $319.77 per share. The Information Technology sector followed second, topped by Cisco Systems (NASDAQ: CSCO), which added 5.24%/2.54 points to trade at $50.99. The Materials sector came in third, led by Albemarle Corporation (NYSE: ALB), which gained 4.70%/12.83 points to trade at $285.62 per share.
On the other hand, the worst-performing sector was the Consumer Discretionary sector, led by Tesla Inc. (NASDAQ: TSLA), which lost 5.69%/12.20 points to trade at $202.04 per share. Amazon.com Inc (NASDAQ: AMZN) came in second, having shed 2.98%/3.01 points to trade at $98.15 per share.
Technical Outlook: Four-Hours S&P 500 Futures Index Price Chart
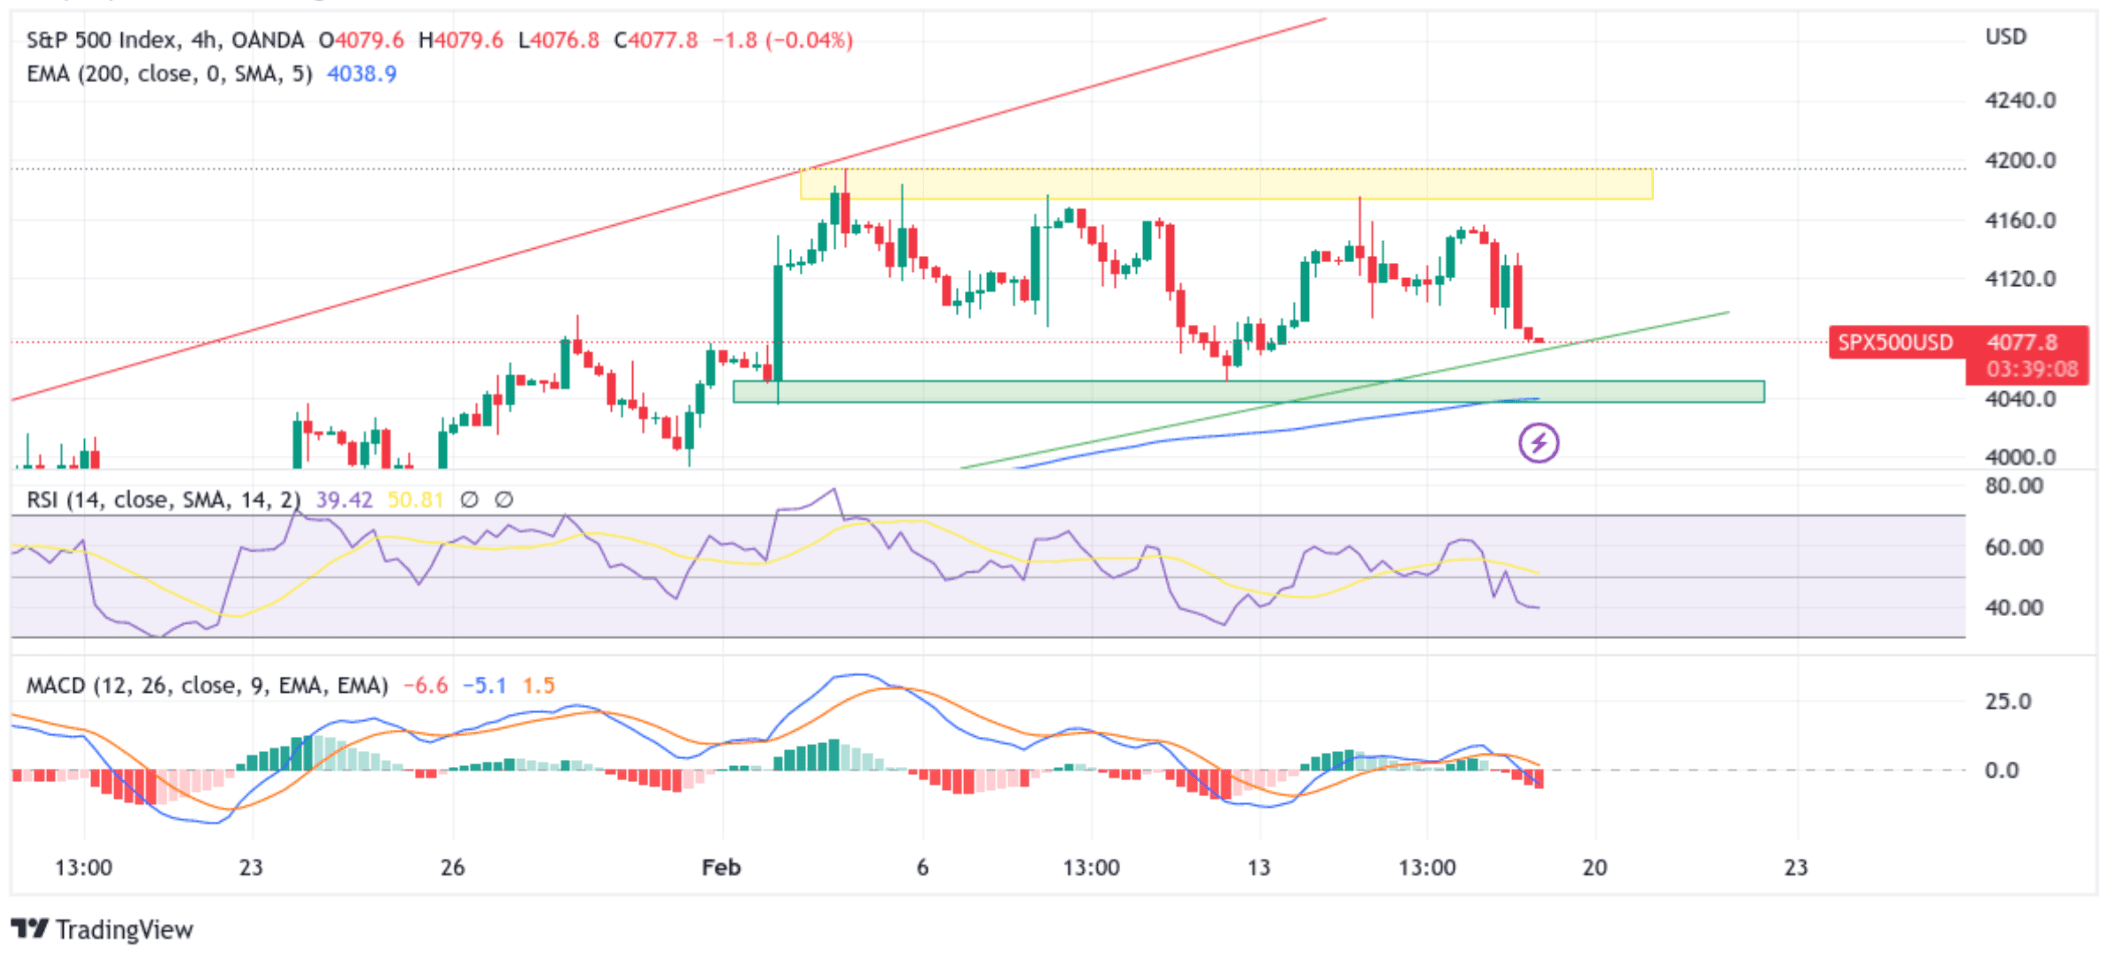
From a technical perspective, the price extended the sharp pullback from the $ 4174.4 level after a firm rejection from the key supply zone. Some follow-through selling would drag spot prices to the immediate hurdle plotted by a one-week ascending trendline extending from the early January 2023 swing low. A clean break below the aforementioned trendline would pave the way for a drop toward the key demand zone ranging from $4035.7 - $4051.4 levels. It is worth noting the lower limit of this zone coincides with the technically strong 200 Exponential Moving Average (EMA). A convincing break below these barriers would pave the way for aggressive technical selling around the S&P 500 futures index.
The technical oscillators on the chart are all in bearish territory, with the RSI (14) below the signal line at 39.42. On the other hand, the Moving Average Convergence Divergence (MACD) Crossover is below the signal line, pointing to a bearish sign for price action this week. Traders should wait to confirm the continuation of the bearish trajectory after the price breaks below the key demand zone and moves convincingly below the 200 EMA before placing aggressive bearish bets.
On the flip side, if buyers resurface and spark a bullish turnaround, initial resistance comes at the $4092.5 level. On further strength, the focus shifts to the key supply zone ranging from $4173.3 to $4194.0. If the price pierces this barrier, it will pave the way for aggressive technical buying.


