AUS200 Index Weakens Below 7100.00 Mark On Weak Japan Economic Data, China's Inflation Data Eyed


Key Takeaways:
- The AUS200 Index moved below the 7100.00 mark on Friday, weighed down by various factors
- Disappointing Japanese GDP data weighs on investor sentiment and helps cap the upside for the main index
- Westgold Resources, Ltd. (Sydney: WGX) and Omni Bridgeway, Ltd. (Sydney: OBL) led the list of top gainers and losers on Friday
- Markets focus shifts toward releasing key Chinese inflation data for fresh directional impetus

The AUS200 Index edged lower on Friday during the Asian session, weighed down by fears of further interest rate hikes from the Federal Reserve (Fed) and the fresh batch of disappointing Japanese macro data, to extend selling for the fourth consecutive day. As of press time, the AUS 200 has lost over 0.3%/21.6 points to trade at the $7142.98 level. The move follows an extension of the modest bounce from the vicinity of the $7342.7 level touched on Monday to register a fourth consecutive day of losses in the last five.
A Japanese Cabinet Office report released early today showed the Japanese economy expanded 1.2% QoQ in Q2 of 2023, compared with a flash reading of a 1.5% gain after a downwardly revised 0.9% rise in Q1. This was the second straight quarter of growth, coming slightly less than market forecasts of a 1.3% rise despite being the fastest growth since Q2 of 2022. On a year-to-year basis, Japan's economy grew 4.8% in Q2 of 2023, compared to the market consensus of 6% and down from 5.5% the previous quarter.
Further contributing to the sentiment around the primary index is the softer U.S. macro data released on Thursday, which showed that the U.S. labor market continues to remain tight, suggesting the Fed could continue its rate hiking cycle. A U.S. Department of Labour report showed that the number of Americans filing for unemployment benefits fell by 13,000 to 216,000 on the week ending September 2nd, well below market expectations of 234,000, marking the lowest level since February. Meanwhile, continuing claims fell by 40,000 to 1,679,000 in the prior week, the lowest since mid-July and sharply below market expectations of 1,715,000.
In contrast, the Reserve Bank of Australia (RBA) announced earlier this week that it had left its cash rate target unchanged at 4.10% during Governor Philip Lowe's final meeting, extending the rate pause for the third successive month and coming in line with market consensus. Tuesday's decision was widely expected amid cooling signs of inflation in Australia. Following the Central Bank's decision, the main index edged higher on Tuesday before retracing and closing in modest losses as investors shied away from risk-perceived assets in favor of safe-haven assets.
In that same line, an Australian Bureau of Statistics report on Thursday showed Australia's trade surplus declined to AUD 8.04 billion in July 2023 from a downwardly revised AUD 10.27 billion in June, below market forecasts of an AUD 10 billion gain. It was the smallest trade surplus since February 2022, as exports shrank while imports rose.
AUS 200 Index Movers
Here are the top AUS 200 index movers today in a week in which the index is set to close with heavy losses.
Top Gainers⚡
- Westgold Resources, Ltd. (Sydney: WGX) added 7.06%/0.118 points to trade at $1.782 per share.
- Resolute Mining, Ltd. (Sydney: RSG) rose 3.73%/0.013 points to trade at $0.347 per share.
- Regis Resources, Ltd. (Sydney: RRL) gained 2.07%/0.033 points to trade at $1.603 per share.
Top Losers💥
- Omni Bridgeway, Ltd. (Sydney: OBL) lost 5.51%/0.12 points to trade at $2.15 per share.
- Platinum Investment Management, Ltd. (Sydney: OBL) declined 4.74%/0.07 points to trade at $ 1.30 per share.
- Mineral Resources, Ltd. (Sydney: OBL) shed 3.65%/2.62 points to trade at $69.15 per share.
As we advance, investors look forward to releasing the Chinese PPI and CPI data for August, which are expected to show a rise in inflation pressure in China from the previous month.
Technical Outlook: One-Day AUS200 Price Chart
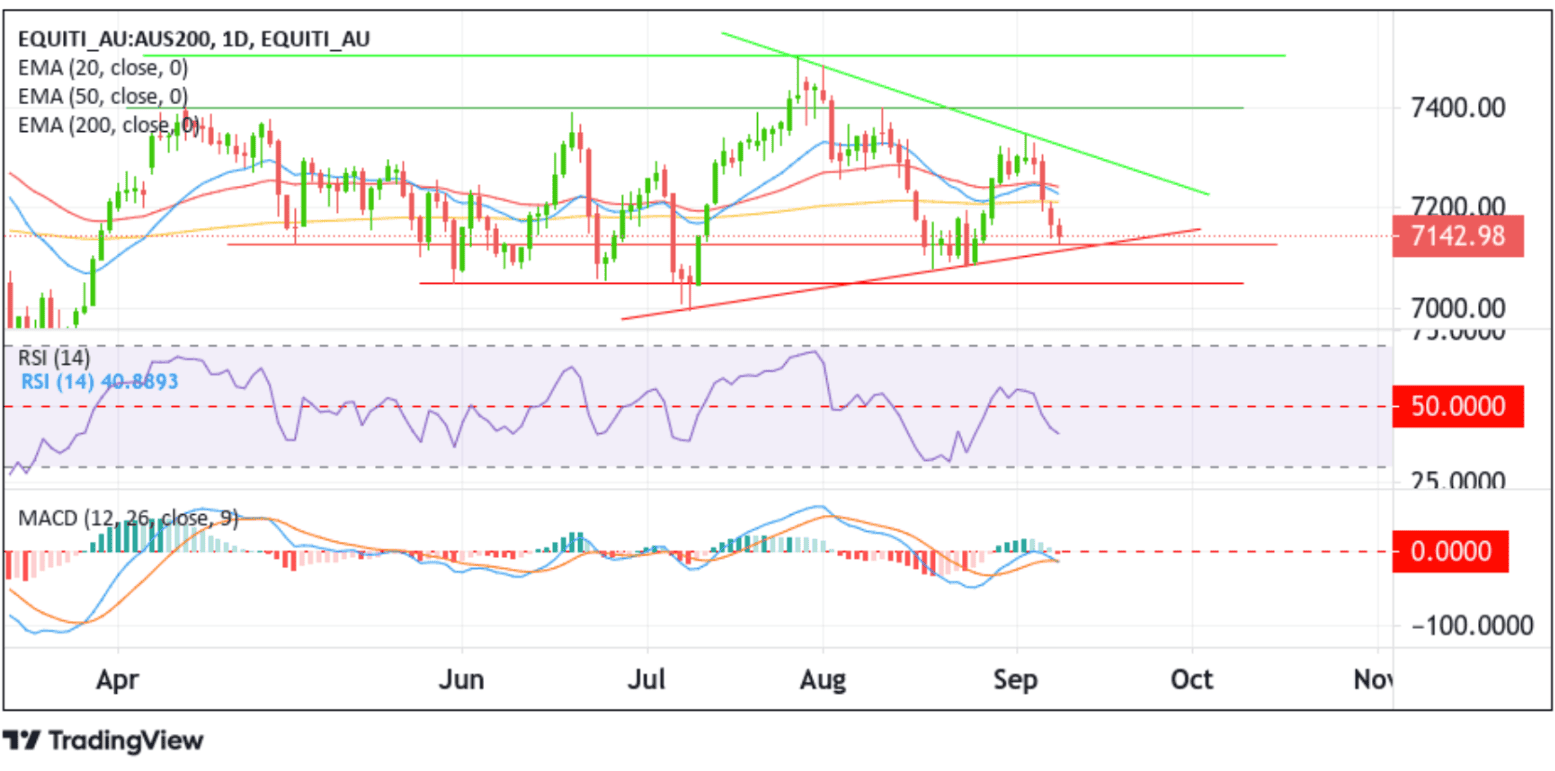
From a technical standpoint, some follow-through selling would face initial resistance at the 7128.90 horizontal level, which sits above the lower limit of the bearish pennant chart pattern extending from the early July 2023 swing low. A subsequent break below these barriers will be a fresh trigger for sellers to push down the price. The downtick could then be extended toward the 7052.08 support level. A decisive break below this level will pave the way for further losses around the main index.
All the technical oscillators on the chart are in negative territory, suggesting the continuation of the bearish price action. Further supporting the bearish outlook is the acceptance of the price below the technically strong 200-day (yellow) Exponential Moving Average (EMA) at the 7210.08 level. Additionally, a Doji candlestick on July 4th supported the case for downside moves (reversals), adding credence to the bearish bias.
Conversely, if buyers overpower sellers, initial resistance appears at the 200-day (yellow) EMA level 7210.08. A convincing move above this level would negate any near-term bearish outlook and pave the way for aggressive technical buying. The bullish trajectory could then be extended above the 20 (blue) and 50 (red) days EMA levels at 7214.06 and 7228.21 levels, respectively, toward the upper limit of the bearish pennant chart pattern extending from the late July 2023 swing low. A subsequent break (bullish price breakout) above this resistance level would reaffirm the bullish bias and pave the way for a rally toward the 7399.63 resistance level. A decisive flip of this resistance level into a support level will pave the way toward the July 2023 record high at 7499.60.