S&P 500 Futures Index Starts The Month On The Right Foot As Markets Await August's Job Data


Key Takeaways:
- The US 500 futures index bounced back from last month's heavy losses with a modest rise on Friday
- Softer U.S. data reports on Thursday cement market expectations of a hawkish Fed
- Technology and Healthcare companies lead the list of top gainers and losers, respectively, before the bell
- Markets keenly await the release of August's Job data report for fresh directional impetus

The US 500 futures index ticked slightly higher on Friday during the Asian session to register a fifth day of positive movement in the last six and kick off the month on the right foot as investors looked ahead to the upcoming August payrolls report data.
As of press time, futures tied to the S&P 500 have gained over 0.05%/21 points to trade above the $4512.0 level. The move follows a modest bounce from the vicinity of the $4510.5 level touched earlier in the session, which almost coincides with the previous day's close. Furthermore, the moves follow a lackluster day on Wall Street, as softer data reports on Thursday cemented market expectations of a hawkish Fed. This, in turn, saw the main index drop by more than 0.20%/91 points, reversing some of this week's gains and snapping a four-day winning streak to close the month below the $4510.00 mark.
Data released Thursday before the bell by the U.S. Bureau of Economic Analysis showed Core PCE prices in the U.S., excluding food and energy, increased by 0.2% month-over-month in July 2023, maintaining the same pace as in June and aligning with market expectations. The annual rate, regarded as the Federal Reserve's preferred measure of inflation, saw a slight rise as anticipated, reaching 4.2% from June's 4.1%.
Additionally, the number of Americans filing for unemployment benefits edged down by 4,000 from the prior week's upwardly revised value to 228,000 on the week ending August 26th, defying market expectations of 235,000 and underlying the still tight U.S. labor market.
The upbeat macro data has, to a greater extent, cemented market expectations that the Federal Reserve (Fed) will hike interest rates one more time by 25 basis points (bp) during the September or November meeting. This, combined with Powell's hawkish remarks at the Wyoming retreat and the Fed's August FOMC Meeting Minutes, has seen the odds for a 25 basis point rate hike increase slightly from last week, despite the majority of the odds remaining in favor of a Fed pause.
US 500 Index Movers
Here are the top US 500 index movers today before the bell, in a week when the index is set to close with heavy gains.
Top Gainers⚡
- Western Digital Corp. (NASDAQ: WDC) added 5.83%/2.48 points to trade at $45.00 per share.
- Arista Networks, Inc. (NYSE: ANET) rose 4.35%/8.13 points to trade at $195.23 per share.
- Seagate Technology Holdings, Plc. (NASDAQ: STX) gained 3.84%/2.62 points to trade at $70.79 per share.
Top Losers💥
- Dollar General Corp. (NYSE: D.G.) lost 12.15%/19.16 points to trade at $138.50 per share.
- Insulet Corp. (NASDAQ: PODD) declined 4.92%/9.91 points to trade at $191.71 per share.
- Elevance Health, Inc. (NYSE: ELV) shed 3.84%/17.63 points to trade at $441.94 per share.
As we advance, investors look forward to the release of the closely watched U.S. Monthly employment details- popularly known as the NFP report, later today. The NFP report is expected to show that the U.S. economy created 170K Jobs in August, down from 187K in July.
Technical Outlook: One-Day US 500 Price Chart
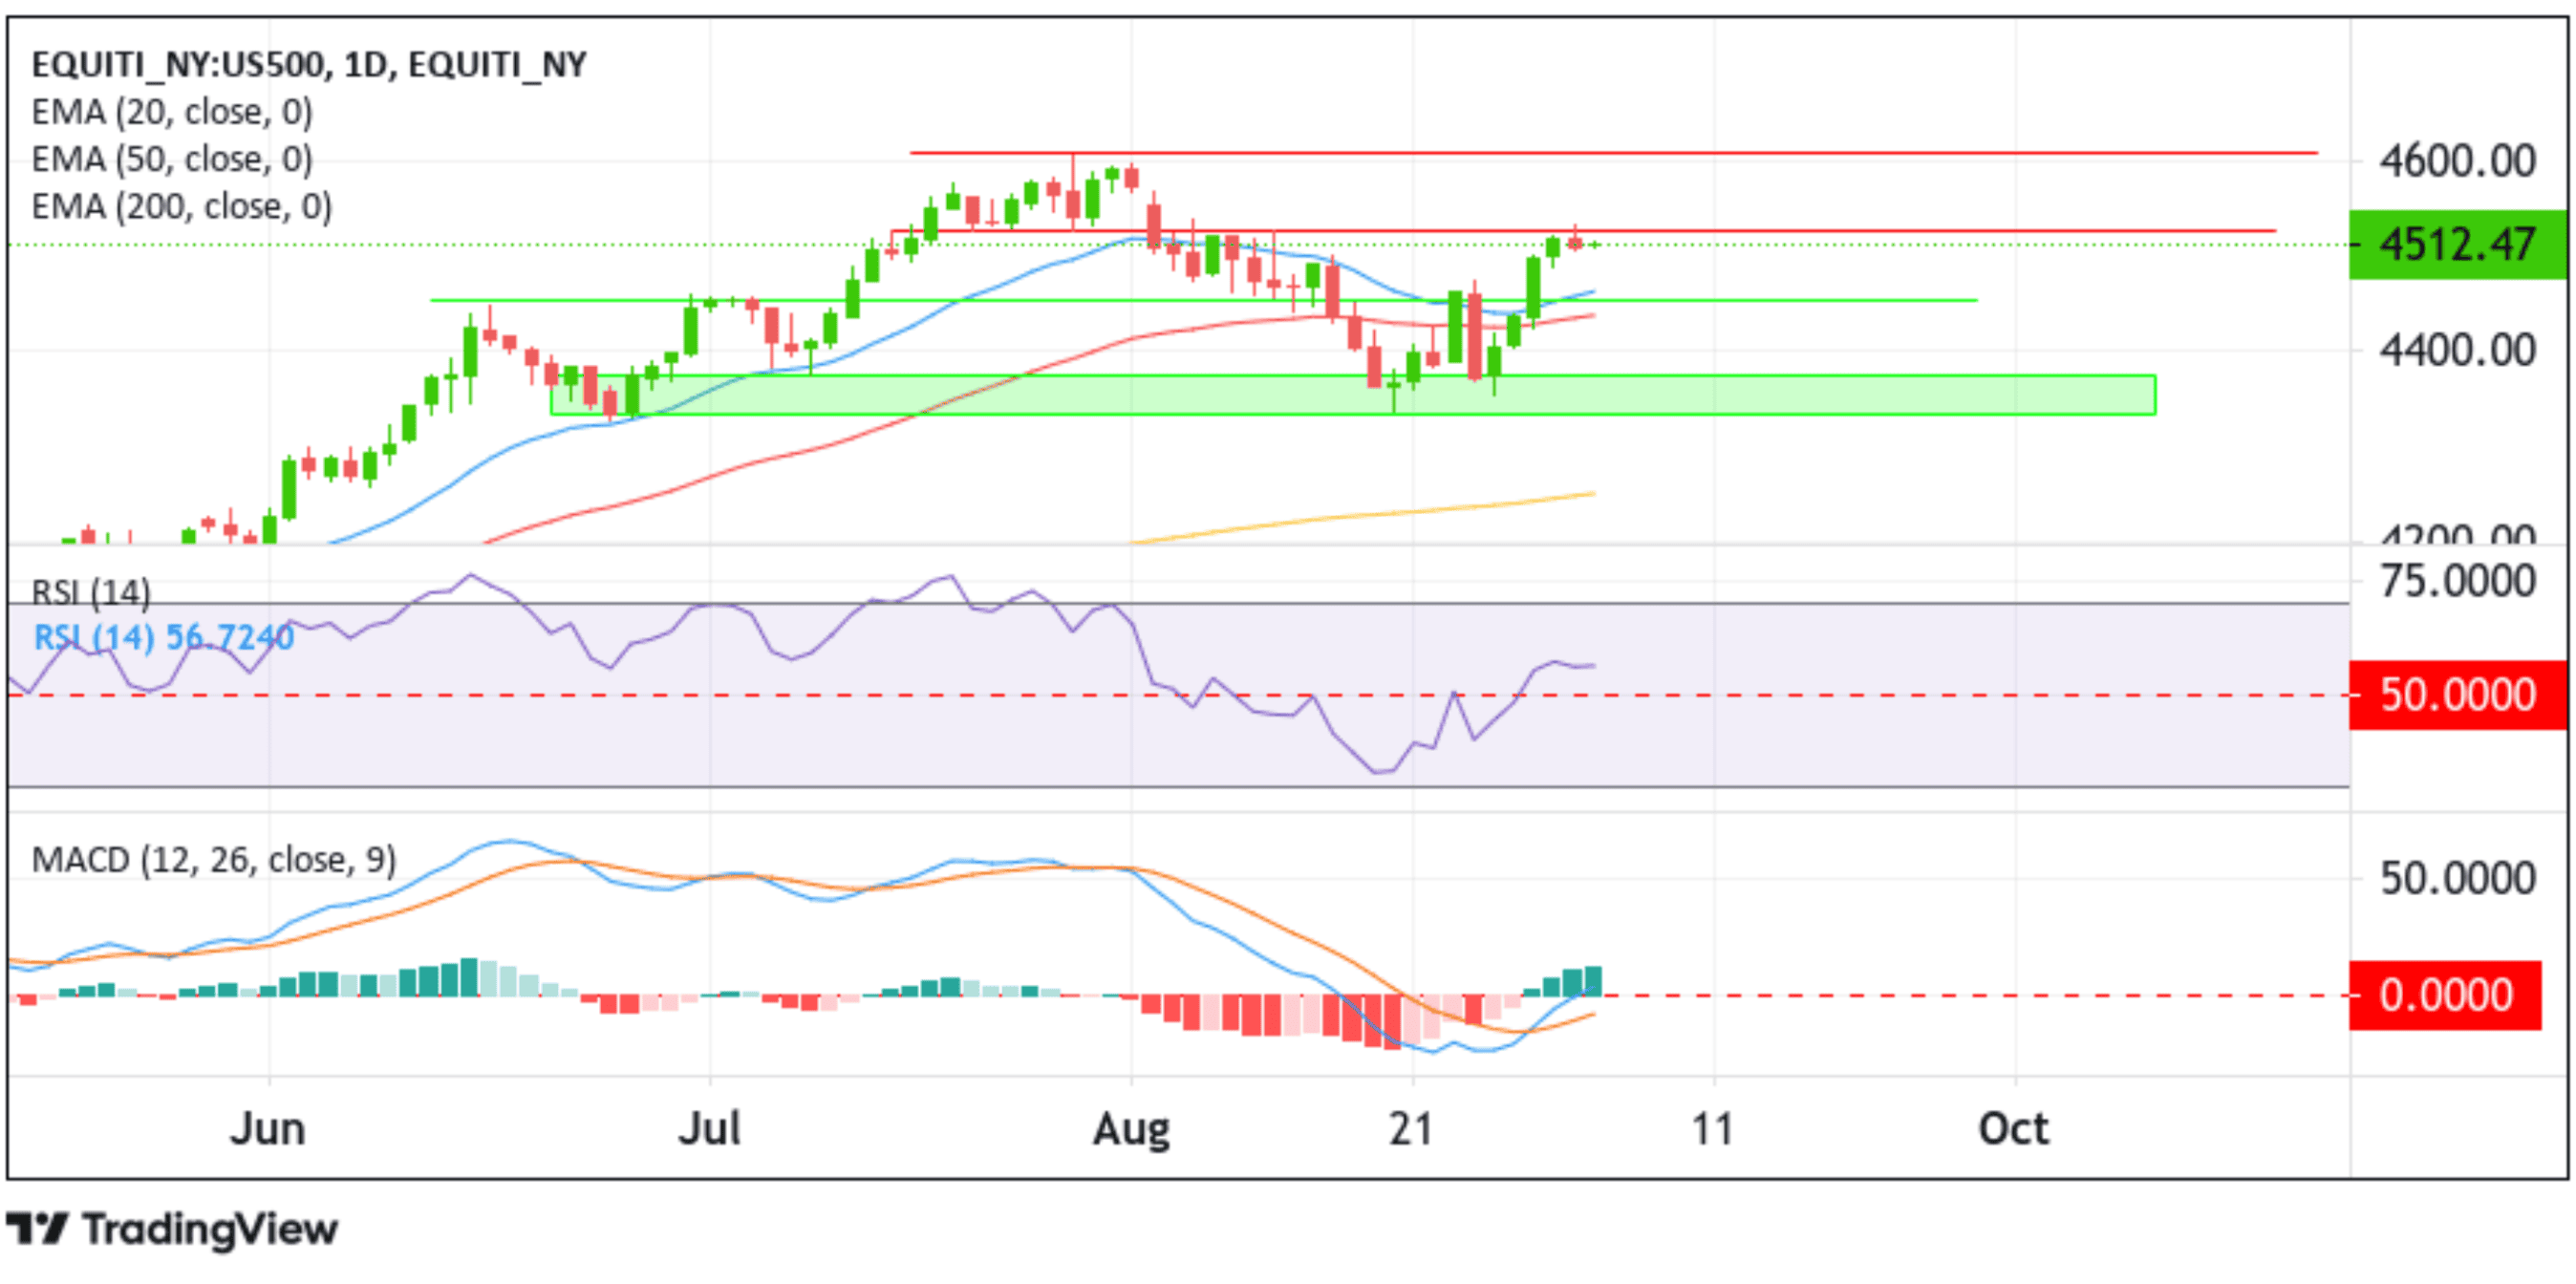
From a technical perspective, a further increase in buying pressure from the current price level would reencounter resistance at the 4531.05 level. If the price pierces this barrier convincingly, upside pressure could accelerate, paving the way for an ascent toward the 4607.32 resistance level. A decisive flip of this resistance level into a support level will reaffirm the bullish thesis and pave the way for further gains around the main index.
On the flip side, if sellers resurface and spark a bearish turnaround, initial support appears at the 20-day (blue) EMA level at 4463.36, which sits above the 4449.19 support level. A convincing move below these barriers, followed by acceptance below the 50-day (red) EMA level at the 4439.97 level, could see the main index accelerate its downfall toward the demand zone ranging from 4371.15 - 4335.85 levels. Sustained weakness below this zone would cause the main to be vulnerable to further downside moves.