S&P500 Futures Index Extends Overnight Trading Gains As Markets Await September Jobs Data


Key Takeaways:
- The S&P 500 futures index inched slightly higher on Friday during the Asian session, extending the overnight trading gains
- Fresh U.S. macro data cements market expectations of a 25bps rate hike before the end of the year
- Lamb Weston Holdings, Inc. (NYSE: LW) and Molson Coors Brewing, Co. (NYSE: TAP) led the list of top gainers and top losers, respectively, before the bell
- The market's focus shifts toward the release of the U.S. NFP data report for fresh directional impetus
The S&P 500 futures index inched slightly higher on Friday during the Asian session, extending the overnight trading gains, but remained over 1.3% down for the week, weighed by rising Treasury yields as investors looked ahead to the upcoming September payroll report data. As of press time, futures tied to the S&P 500 gained over 0.1%/42 points to trade above the $4255.0 level. The move follows an extension of the sharp bounce from the vicinity of the $4198.2 level/weekly low touched on Thursday. Moreover, the moves follow a lacklustre day on Wall Street, as a fresh U.S. macro data report on Thursday cemented market expectations of a hawkish Fed during the November meeting.
Data released Thursday before the bell by the U.S. Department of Labor showed that the number of Americans filing for unemployment benefits increased by 2,000 to 207,000 on the week ending September 30th, below estimates of 210,000 and remaining close to the seven-month low of 202,000 from earlier in the month. To a greater extent, the data has added evidence that the labor market remains historically tight, pointing to added resilience to the Federal Reserve's aggressive tightening cycle and adding leeway for rates to remain higher for longer.
The softer U.S. macro data comes on the heels of a string of data in the past few weeks that suggested the Fed will likely stick to a hawkish stance during the November or December meeting. Additionally, the upbeat U.S. Initial Jobless Claims data report comes from recent hawkish comments by top Fed officials who advocated for increased rate hikes for a longer time to bring inflation back to target.
The recent series of hawkish comments from Fed officials saw the U.S. Treasury bond yields rise to one of their highest levels this month, which in turn was seen as a key factor that supported the greenback and helped exert downward pressure on the main index, which is now on course to its fifth week of losses. Investors now hope the incoming September Jobs data will be softer than expected. This will help thwart the bullish pressure around the U.S. Treasury bond yields and help pull a major recovery around the equity markets.
Elsewhere, Thursday's U.S. Bureau of Economic Analysis (BEA) report showed the U.S. trade gap narrowed to $58.3 billion in August 2023, the lowest since September 2020, and below forecasts of a $62.3 billion deficit. Exports decreased $0.2 billion to $10.9 billion and imports fell $1.4 billion to $33.7 billion.
Gainers and Losers
Here are the top S&P500 index movers today before the bell, a week in which the primary index is on pace for its fifth consecutive losing week.
Top Gainers⚡
The top performers on the S&P500 Index were:
- Lamb Weston Holdings, Inc. (NYSE: LW) added 8.02%/7.26 points to trade at $97.75 per share.
- MarketAxess Holdings, Inc. (NASDAQ: MKTX) added 5.82%/12.41 points to trade at $225.69 per share.
- DISH Network, Corp. (NASDAQ: DISH) gained 4.12%/0.20 points to trade at $5.18 per share.
Top Losers💥
The worst performers on the S&P500 Index were:
- Molson Coors Brewing Co. (NYSE: TAP) lost 6.30%/3.97 points to trade at $59.06 per share.
- Mondelez International, Inc. (NASDAQ: MDLZ) declined 5.26%/3.61 points to trade at $141.58 per share.
- Clorox, Co. (NYSE: CLX) shed 5.23%/6.90 points to trade at $124.93 per share.
As we advance, investors look forward to the release of the U.S. monthly jobs data report, popularly known as Nonfarm Payrolls (NFP), which is expected to show a drop in the number of people employed last month by 163k compared to 187k employed in August.
Technical Outlook: One-Day S&P 500 Index Price Chart
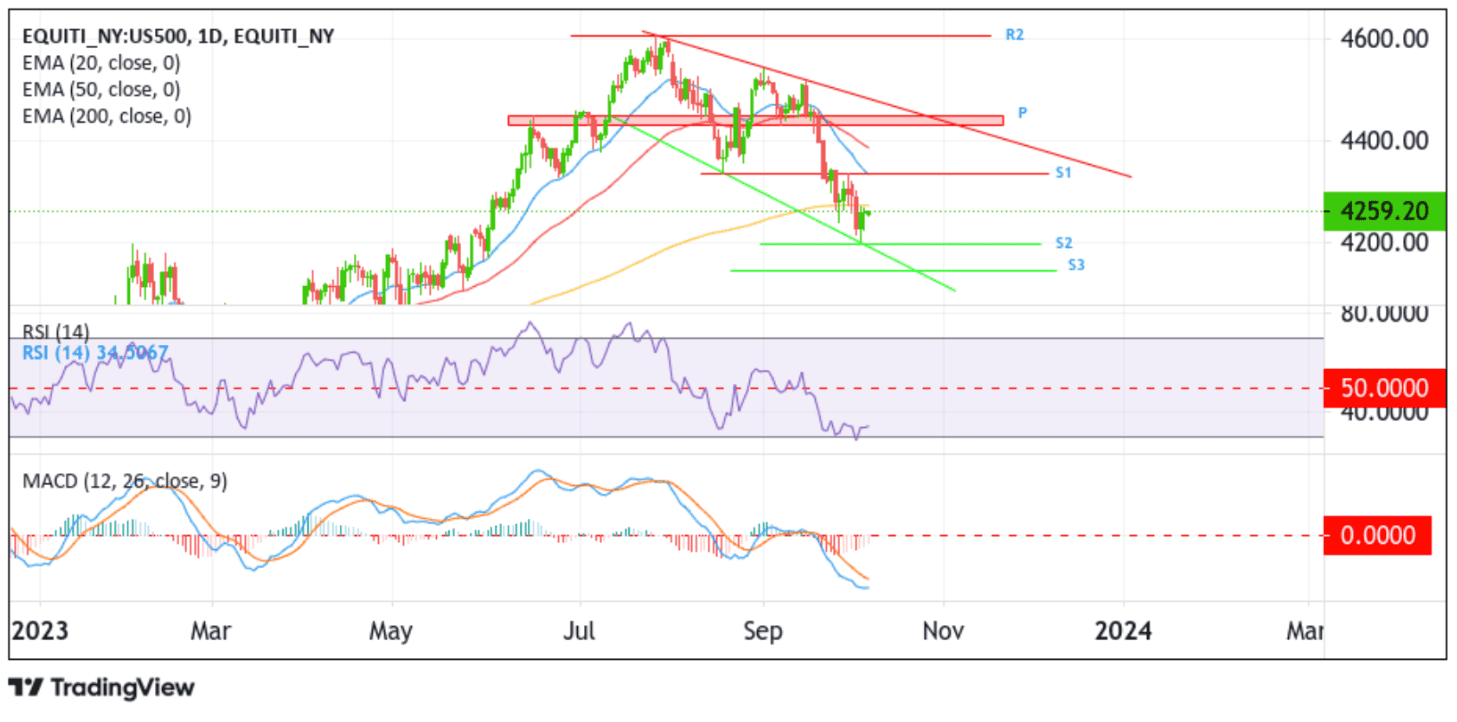
From a technical perspective, the prices' ability to break below the demand zone ranging from 4450.33 - 4429.77 levels (pivot levels), followed by a convincing move below the technically strong 200-day (yellow) level at 4279.53, favored sellers and paved the way for further losses around the main index. Apart from this, all the technical oscillators (RSI (14) and MACD) on the chart are in the dip-bearish territory, suggesting continuing the bearish price action this week. The current pullback is still seen as a selling opportunity, and traders should wait for near-term consolidation below the 4279.53 level before placing fresh bearish bets.
If sellers resurface and spark a bearish turnaround, initial support comes in at the 4200.6 level. On further weakness, the main index price could drop to the key support level plotted by a descending trendline extending from the mid-August 2023 swing low. A subsequent break below this support level would make the main index vulnerable to extending the downward trajectory towards the 4140.37 support level (S2).