Nasdaq 100 Index Rebounds And Moves Back Above $15,200.00 Mark Ahead Of Big Bank Earnings Report


Key Takeaways:
- The Nasdaq 100 futures index rebounded on Friday during the Asian session and moved back above the $15,200.00 mark.
- A U.S. BLS report showed inflation in the U.S. continues to remain stubborn, which in turn cements market expectations of a hawkish Fed.
- Fastenal, Inc. (NASDAQ: FAST) and JD.com, Inc. (NASDAQ: JD) led the list of top gainers and top losers, respectively, before the bell.
- The market's focus shifts toward the release of the Big Bank Earnings Report for fresh directional impetus.
Nasdaq 100 futures edged slightly higher on Friday during the Asian session as investors continued to assess the latest U.S. inflation data and its implication on future monetary policies while waiting for major bank earnings reports.
As of press time, futures tied to the Nasdaq 100 rose over 0.05%/(7.7 points) to settle above the $15,200.00 level. The move follows an overnight bounce from the vicinity of the $15,088.9 level in the after-trading hours on Thursday. Additionally, the moves follow a disappointing day on Wall Street, following a heavy sell-off for the better part of Thursday as the hotter-than-expected U.S. consumer price inflation (CPI) data cemented market expectations of a hawkish Fed.
A U.S. Bureau of Labor Statistics report on Thursday showed inflation in the U.S. increased by 0.4% last month and by 3.7% from a year ago. That compared with the respective Dow Jones estimates of 0.3% and 3.6%. Excluding food and energy, the annual inflation rate in the U.S. fell to 4.1% in September 2023, the lowest since September 2021, down from 4.3% in the prior month, matching market forecasts. On a monthly basis, core consumer prices rose by 0.3% from a month earlier in September, the same pace as in August, also in line with market estimates.
The immediate implication of the data report saw the primary index slip by more than 0.7%/106.3 points before paring losses and close with modest losses below the $15,200.00 mark. On the other hand, the U.S. dollar index (DXY), which measures the greenback against a basket of currencies, rose by more than 0.8%/85 points to one of its best days in over a week before closing in heavy gains above the 106.500 mark.
That said, the U.S. Consumer Inflation Report comes on the heels of softer U.S. macrodata released the past few days, which showed the U.S. labor market continues to be resilient despite Fed interest rate hikes while wholesale inflation at the producer level continues to remain stubborn, reaffirming market expectations of at least one rate hike by the Fed before the end of the year.
Additionally, the macrodata comes on the heels of the ongoing war in the Middle East following a surprise attack on Israel by Palestinian militant group Hamas over the weekend. In response, Israel launched airstrikes on Gaza and declared war against the Palestinian enclave of Gaza on Sunday. At the time of writing, casualties on both fronts have risen massively. In a move to prevent the worsening of the situation, the UN has now called for the evacuation of 1.1 million residents in north Gaza to move south in the next 24 hours.
Noteworthy, the ongoing Israel-Hamas war helped boost demand for safe-haven assets, which in turn acted as a tailwind to the greenback. However, receding fears of the war on global oil supply and prices helped push the primary index higher the past few days, with the index now on course to finish this week with heavy gains.
In other news, a U.S. Department of Labor report on Thursday showed that the number of Americans filing for unemployment benefits was unchanged from the prior week at 209,000 on the week ending October 7th, below estimates of 210,000 and remaining close to the seven-month low of 202,000 from September.
Gainers and Losers
Here are the top S&P500 index movers today before the bell, a week in which the primary index is on pace for its fifth consecutive losing week.
Top Gainers⚡
The top performers on the Nasdaq100 Index were:
- Fastenal, Inc. (NASDAQ: FAST) rose 7.52%/4.21 points to trade at $60.22 per share.
per share. - Walgreens Boots Alliance, Inc. (NASDAQ: WBA) added 7.04%/1.59 points to trade at $24.19 per share.
- KLA, Corp. (NASDAQ: KLAC) gained 3.83%/18.48 points to trade at $501.11 per share.
Top Losers💥
The worst performers on the Nasdaq100 Index were:
- JD.com, Inc. (NASDAQ: JD) lost 8.27%/2.51 points to trade at $27.83 per share.
- Atlassian, Corp. (NASDAQ: TEAM) declined 6.54%/13.05 points to trade at $186.40 per share.
- Warner Bros. Discovery, Inc. (NASDAQ: WBD) shed 5.84%/0.64 points to trade at $10.32 per share.
As we advance, investors look forward to the release of the third-quarter earnings reports of major U.S. financial firms: JPMorgan, Wells Fargo, Citigroup, and BlackRock. Investors will further look for cues from the release of the Michigan Consumer Sentiment preliminary data report.
Technical Outlook: One-Day Nasdaq 100 Price Chart
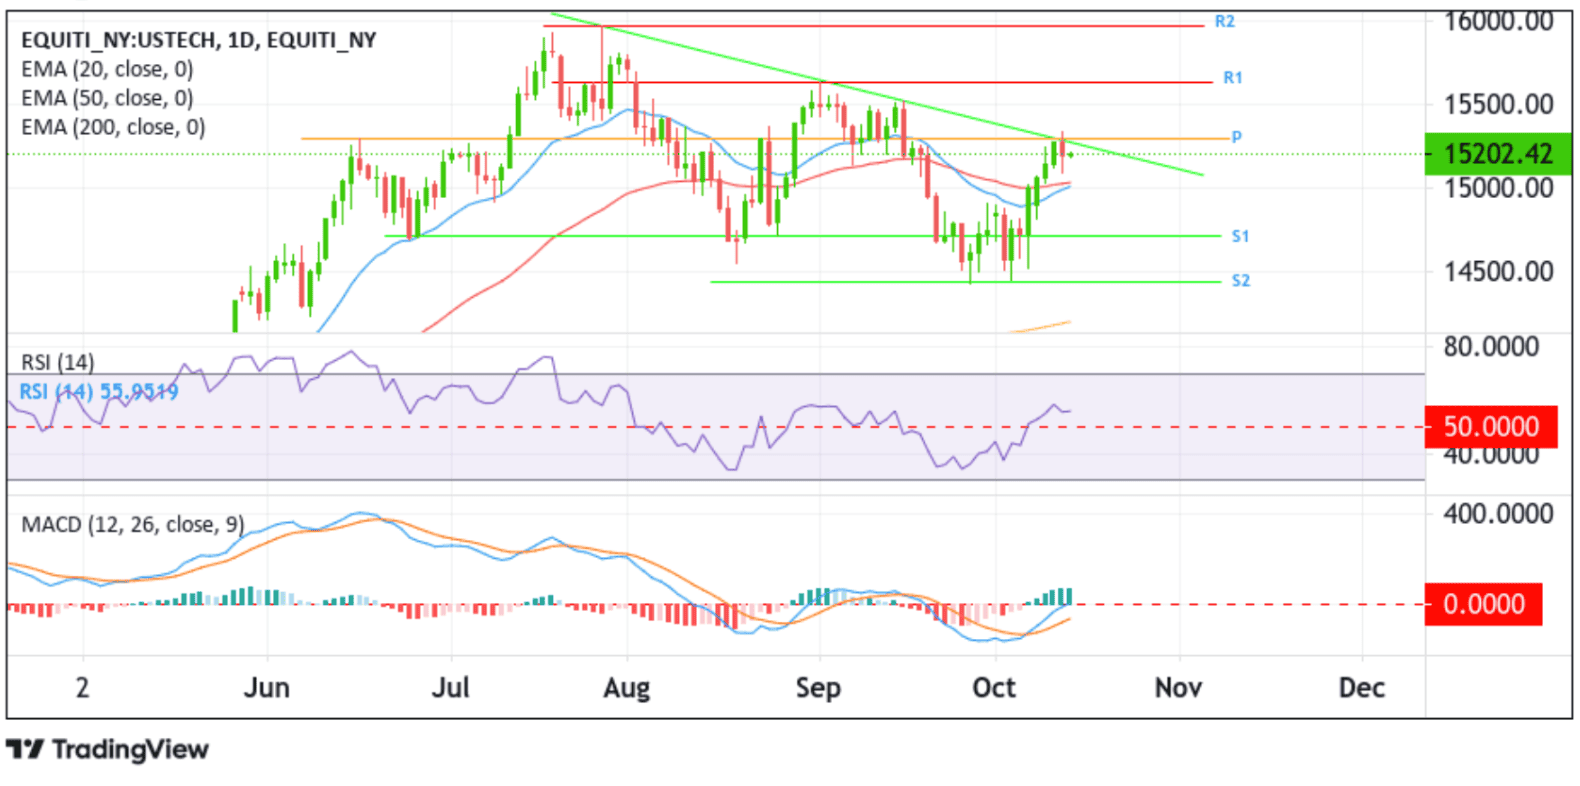
From a technical standpoint, a further increase in buying momentum from the current price level would encounter initial resistance at the key resistance level plotted by a downward-sloping trendline extending from the late-July 2023 swing high, which coincides with the 15290.39 pivot level (P). A clean break above this barrier would reaffirm the bullish bias and would set the main index on course for an extension of the bullish trajectory toward the 15630.26 resistance level (R1). A subsequent move above this level will pave the way for a move toward the 2023 record high resistance level (R2) at the 15946.3 level.
On the flip side, if bears spark a bearish reversal, initial support comes in at the 20 (blue) and 50 (red) days Exponential Moving Average (EMA) at 15033.66 and 15005.81 levels, respectively. Acceptance below these levels could see the main index drop toward the 50% and 61.8% Fibonacci retracement levels at 14894.40 and 14782.98, respectively. Sustained weakness below these levels will pave the way for an accelerated decline toward the 14709.03 resistance level (R1), followed by 14437.07 resistance level (R2).