US WTI Crude Oil Rebounds After OPEC+ Maintains Group's Oil Output Policy


Key Takeaways:
- US WTI crude oil price rebounded during the early-Asian session, supported by supply concerns
- OPEC+, during a meeting on Wednesday, reaffirmed their commitment to maintain the group's oil output policy
- Crude oil prices continue to face heavy headwinds stemming from rising U.S. Treasury yields, which continue to offer support to the greenback and might help limit further crude oil gains

The U.S. WTI crude oil price ticked slightly higher on Thursday during the early-Asian session, recovering some of its previous losses as an OPEC+ panel on Wednesday maintained oil output cuts to keep supply tight despite concerns of slumping economic growth. As of press time, the precious black liquid is up 0.14%/ (12 cents) for the day after capitalizing on the overnight bounce from the vicinity of the 84.13 level/ weekly low supported by supply concerns.
The Organization of the Petroleum Exporting Countries (OPEC) and its joint Ministerial Monitoring Committee (JMMC) reaffirmed their commitment on Wednesday to maintain the group's oil output policy. It is worth noting that the oil production cuts in terms of barrels per day currently stand at more than 2 million, with top OPEC+ producers Saudi Arabia and Russia leading the group at 1 million and 300,000 barrels per day, respectively.
Further underpinning crude oil prices is the U.S. Energy Information Administration (EIA) report on Wednesday, which showed Crude oil inventories in the U.S. fell by 2.224 million barrels in the week ending September 29, 2023, following a 2.17 million decline in the previous period, and way more than market forecasts of a 0.446 million drop, despite the combination of supporting factors, crude oil prices continue to face heavy headwinds stemming from rising U.S. Treasury yields, which continue to offer support to the greenback. Notably, a stronger greenback makes oil expensive for holders of other currencies and typically undermines oil prices.
That said, worries about further Fed monetary tightening saw crude oil prices drop from a thirteen-month high/94.99 level after a string of data in the past few weeks suggested the Fed will likely hike interest rates by at least 25bps before the end of the year. Apart from this, the hawkish comments by top FOMC members recently suggest that the Fed still needs to be entirely done with its rate hiking cycle this year, with a quarter of a percentage point now looking likely during the November meeting. CME's Fed Watch tool shows Fed fund traders have priced in a 26% chance for a 25bps November rate hike, up from 18% last week.
As we advance, we look forward to the release of the U.S. Initial Jobless Claims data report for the previous week. Investors will further look for cues from releasing the U.S. Trade Balance (Aug) report. The data reports would influence the U.S. dollar price dynamics and provide directional impetus to crude oil prices. The main focus, however, remains on the U.S. monthly jobs data report, popularly known as Nonfarm Payrolls, which is expected to show a drop in the number of people employed last month by 163k compared to 187k employed in August.
Technical Outlook: One-Day US WTI Crude Oil Price Chart
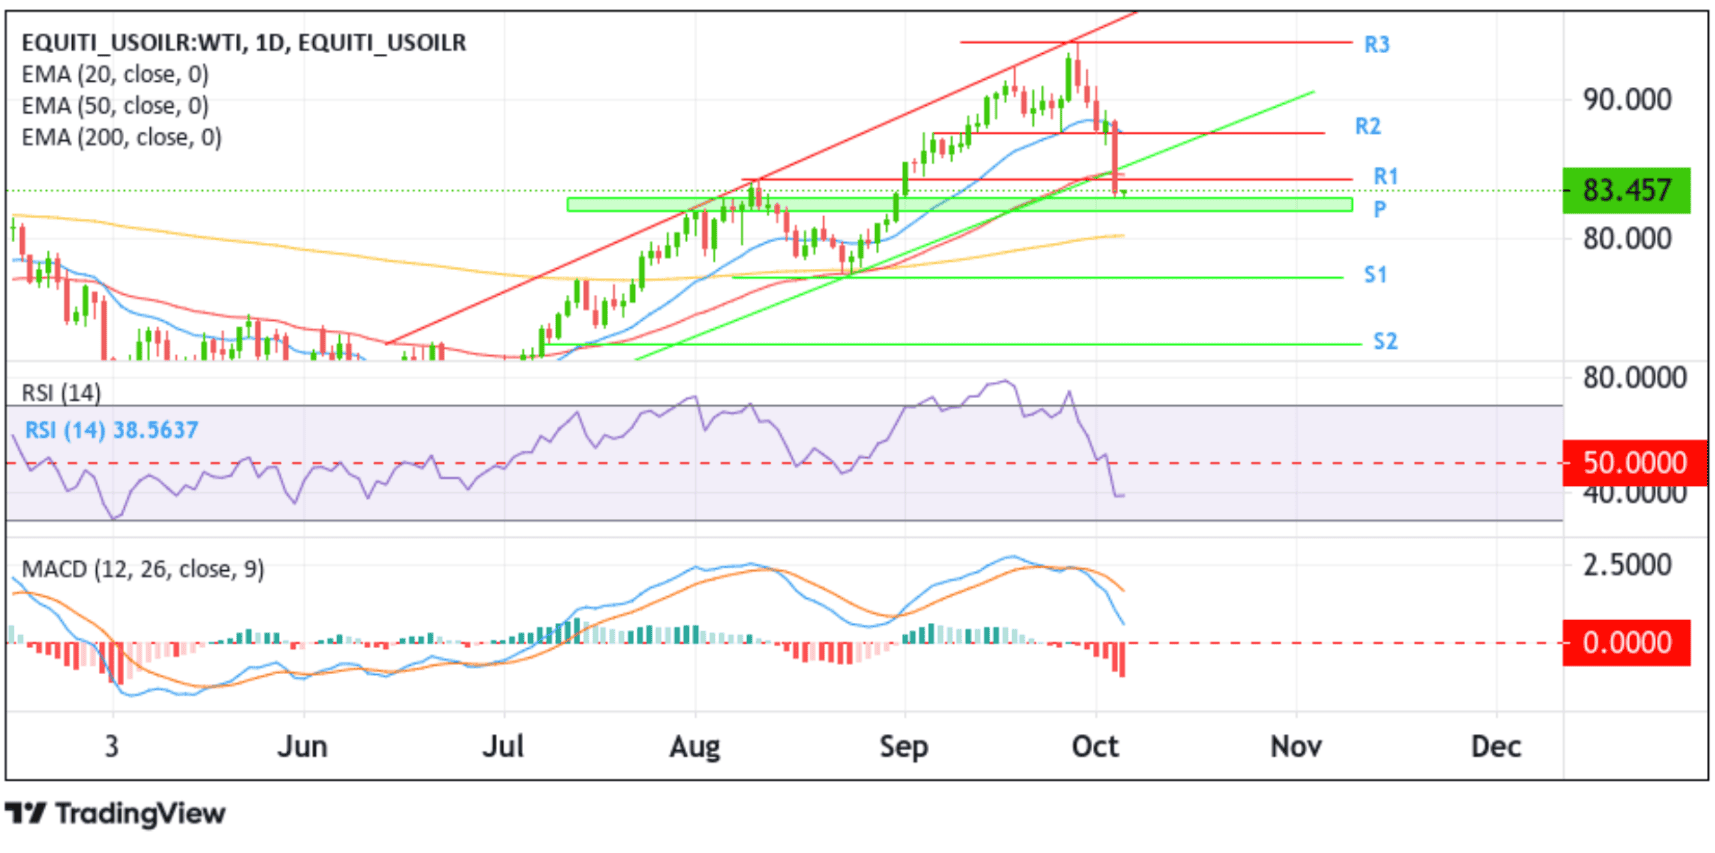
From a technical standpoint, the US WTI crude oil price's ability to find acceptance below the key support level (bearish price breakout) plotted by an ascending trendline extending from the late-June 2023 swing low on Wednesday supported the case for further downtick moves. However, earlier today, the precious black liquid found some support from the upper level of the demand zone, ranging from 82.945 to 82.055 levels (Pivot Zone). Looking at the broader picture, buyers decided to force a bullish turnaround supported by fundamental factors and the general outlook. This remains bullish due to the price acceptance above the technically strong 200-day (EMA) level at 77.121. Aside from this, the MACD technical oscillator is in bullish territory. Increasing buying pressure from the current price level will uplift spot prices toward the immediate barricade at 84.223 (R1). A decisive flip of this resistance level into a support level, followed by a break after that above the key support level (now turned resistance level) plotted by an ascending trendline, would pave the way for an extension of the bullish uptick (pullback) towards the next resistance level at 87.650 (R2) and in highly bullish cases, the pullback could be extended towards confronting the 94.009 resistance level (R3) followed by the key resistance level plotted by an ascending trendline extending from the early-August 2023 swing high.
On the flip side, if sellers return and catalyze a bearish reversal, initial support comes in at the demand zone, ranging from 82.945 to 82.055 levels. Sustained weakness below this zone could see the US WTI crude oil price accelerate its decline toward confronting the technically strong 200-day (yellow) EMA level at 77.121. Failure to defend this level would make US WTI crude oil vulnerable to extending the downward trajectory towards the 72.583 support level (S2) and the 67.834 - 66.934 demand zone.