US WTI Crude Oil Price Rebounds And Drops Back Towards $76.000 Mark On Massive Inventory Build, OPEC Meeting In Focus


Key Takeaways:
- The US WTI crude oil price rebounded on Wednesday during the early Asian session and dropped back close to the 76.000 mark
- Larger-than-expected crude stock pileup acts as a headwind to the precious black liquid
- A modest resurgence in U.S. dollar demand on Tuesday helped limit further gains around dollar-denominated commodity
- Markets are squarely focused on the upcoming OPEC meeting on Nov. 26

The U.S. West Texas Intermediate (WTI) crude oil price edged slightly lower on Wednesday during the Asian session after fresh data pointed to a larger-than-expected crude stock pileup, which offset oil supply tightness poised by further oil supply cuts by OPEC + group.
As of press time, the precious black liquid fell 12 cents (0.15%) to trade at $77.598 per barrel and move close to the $76.000 round mark after rallying the past three days, supported by a weaker U.S. dollar weighed by firm market expectations that the Fed is done with its rate-hiking cycle.
Stocks of crude oil in the U.S. jumped by 9.047 million barrels in the week that ended November 17th, 2023, following a 1.335 million barrel rise in the previous week, data from the API's Weekly Statistical Bulletin showed. It was way above market expectations of a 1.467 million barrel increase. The American Petroleum Institute (API) data indicated that U.S. inventories had increased for the fourth consecutive week, suggesting a steady buildup of oil supplies. This pointed to the resilience of oil stocks, even as fuel demand started to decrease with the onset of the winter season. Additionally, the data suggested that crude supplies might not be as constrained as initially expected.
This notion, coupled with rising U.S. Treasury bond yields and signs of worsening global economic conditions, has weighed heavily on crude oil prices over the past few weeks. Earlier this month, the top OPEC+ producing countries, Saudi Arabia and Russia, announced further commitments to maintain their ongoing crude oil supply cuts until the end of the year, which further weighs on crude oil prices.
However, crude oil prices found some footing late last week from the generally weaker U.S. dollar weighed by retreating U.S. Treasury bond yields amid firm market expectations that the Fed is done with its rate-hiking cycle. This comes after two U.S. Bureau of Labor Statistics reports released last week pointed to cooling inflation pressures at the consumer and producer level, which, together with slowing job and wage growth, fully reinforce market expectations that the Fed is done with its monetary policy tightening campaign. CME's Fed watch tool shows that Fed fund futures traders have priced in a 100% chance that the Fed will leave its Fed Funds rates unchanged at 5.25%-5.5% during the December meeting.
However, a modest resurgence in U.S. dollar demand on Tuesday helped limit further crude oil gains and was seen as a contributing factor that helped cap the upside for US WTI crude oil.
As we advance, oil traders are squarely focused on the upcoming OPEC meeting on Nov. 26, which will help determine the next directional move for the precious black liquid.
Technical Outlook: Four-Hour US WTI Crude Oil Price Chart
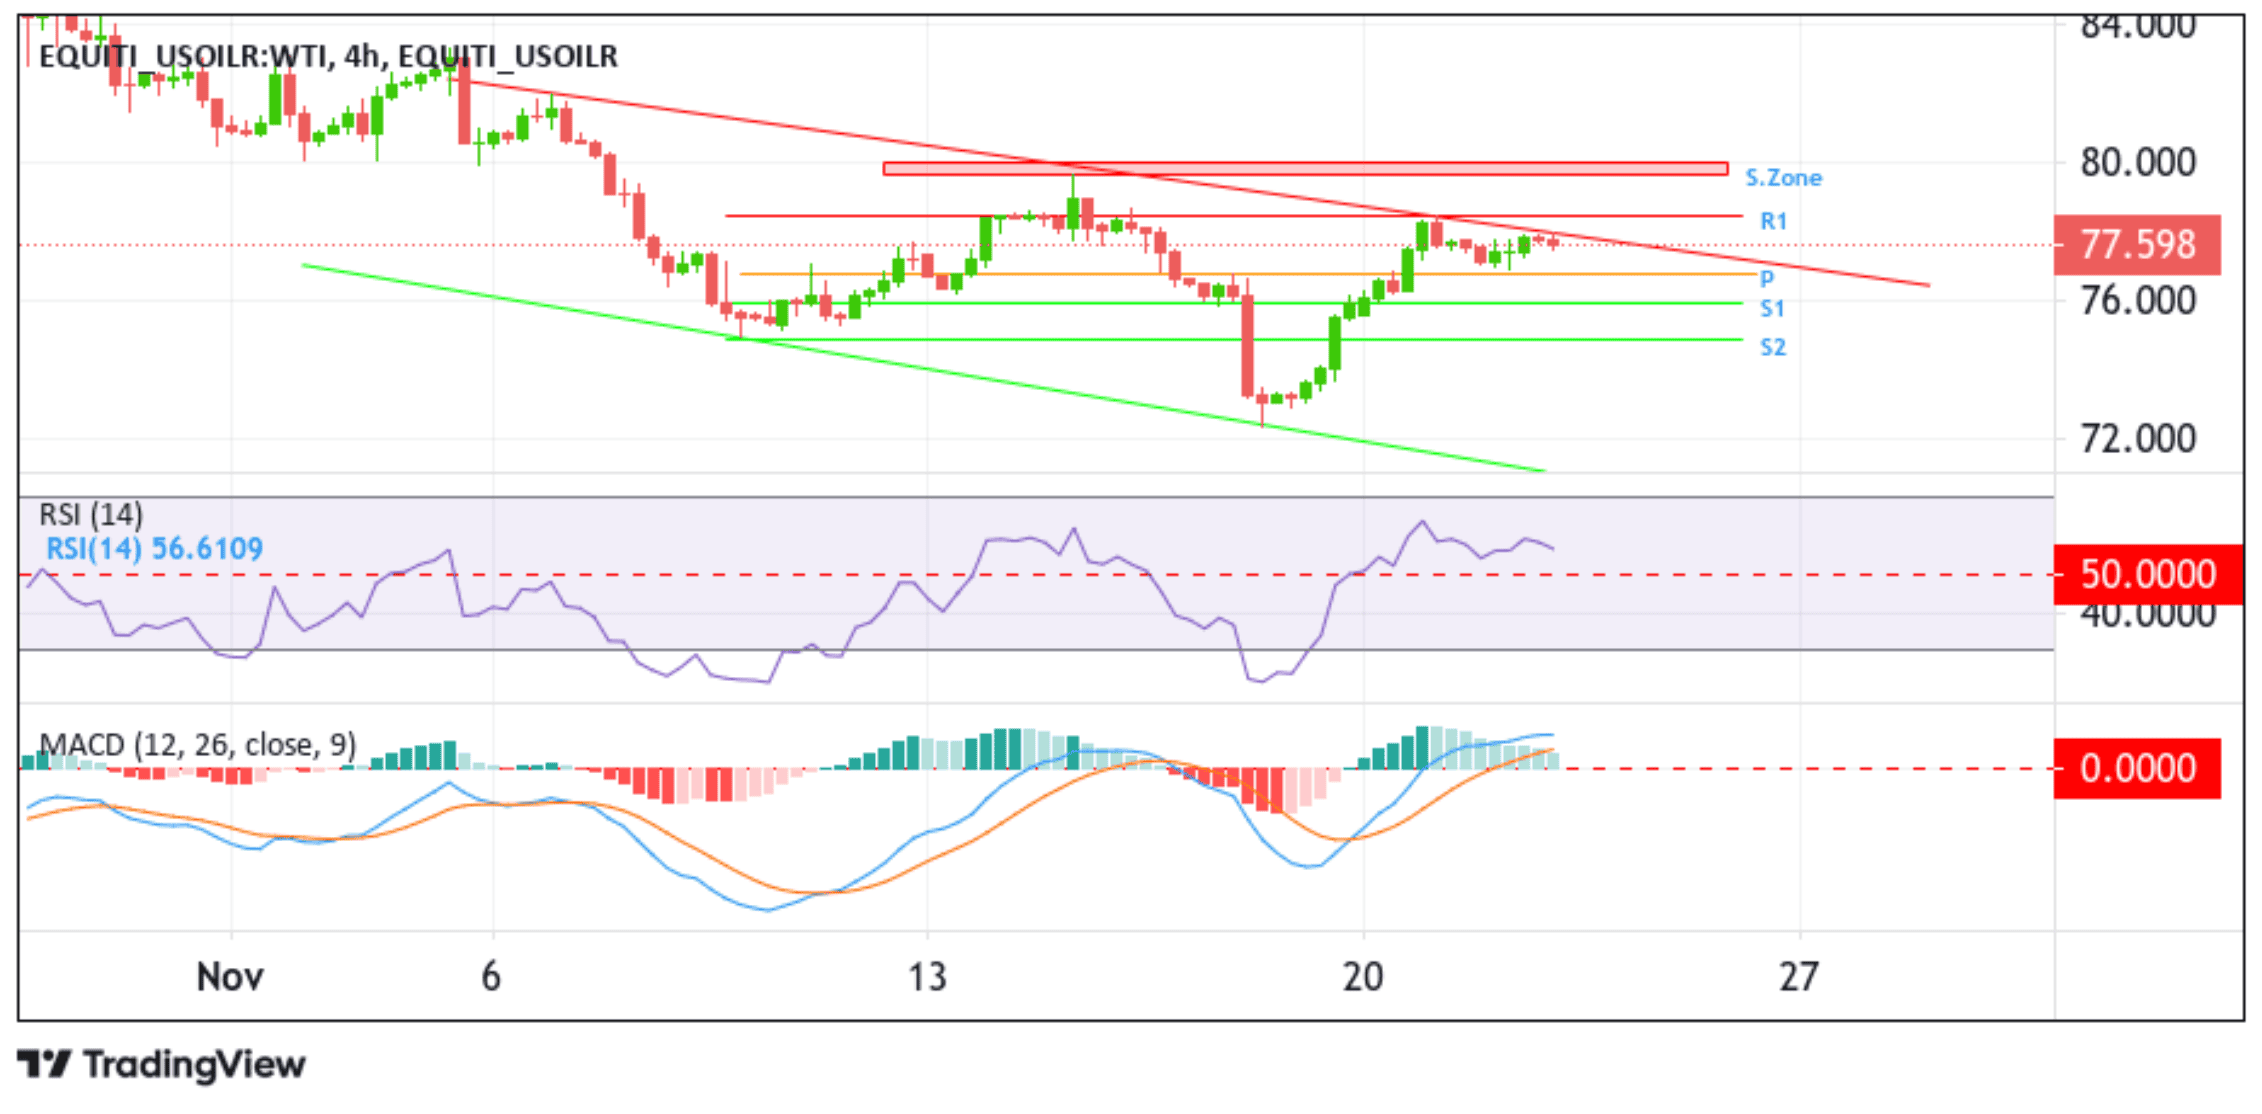
From a technical perspective, U.S. WTI crude oil remains under heavy bullish pressure as the technical oscillators on the chart (RSI (14) and MACD) are in dip-positive territory, suggesting the continuation of the bullish price action. Additionally, the acceptance of price above the pivot level (P), which corresponds to the 61.8% Fibonacci retracement level at 76.846 level, supports the case for further upside moves, thus suggesting the current bullish correction runs the chance of fizzling out sooner or later. That further downtick could still be seen as Buy opportunities.
That said, if buyers jump back in and catalyze a bullish reversal, initial resistance appears at the upper limit of the descending channel pattern. A subsequent break above this barrier( bullish price breakout) would pave the way for a move towards the 78.446 resistance level (R1). A clean move above this level would see US WTI crude oil rise further toward the supply zone, ranging from 80.078 to 79.636 levels. Sustained strength above this zone would act as a fresh trigger for new oil buyers to jump in and help increase the price of precious commodities.