S&P 500 Futures Index Falls Further On Strong Inflation and Job Figures Ahead of Next week's Fed Interest Rate Decision


Key Takeaways:
- The S&P 500 futures index (US500) moved lower on Friday during the Asian session, retaking $5140.00 levels
- A fresh round of hotter-than-expected U.S. inflation data points to sticky inflation in the U.S., while job numbers point to tightness in the labor market
- Before the bell, West Pharmaceutical Services, Inc. (NYSE: WST) and Lennar Corp. (NYSE: LEN) led the list of top gainers and top losers, respectively
- Investors look forward to a slew of second-tier U.S. economic releases for fresh directional impetus; the focus, however, remains on next week's Fed decision
The S&P 500 futures index (US500) inched slightly lower on Friday during the Asian session, weighed by a slight weakness in stocks in the consumer discretionary and information technology sectors. Investors continued to digest the mixed inflation data reports released on Thursday and their impact on the future monetary policy outlook.
As of press time, futures tied to the US500 index fell around 0.07% (3.7 points) to trade at the $5149.7 level. The current price move follows after-hours trading gains that saw the main index pare some of its early losses and close with modest losses above the $5154.00 level following a lacklustre day around Wall Street. Solid inflation and job figures reaffirmed market expectations that the Fed will leave rates unchanged during the March and May meetings and start cutting rates during the third quarter of 2024.

A U.S. Bureau of Labor Statistics (BLS) report released on Thursday showed the Producer Price Index for final demand in the United States rose by 0.6% month-over-month in February 2024, marking the most significant increase since last August and surpassing market expectations of a 0.3% advance. Every year, producer price inflation accelerated to 1.6% from January's 0.9%, easily surpassing forecasts of 1.1%.
The hotter-than-expected wholesale inflation data report comes two days after another U.S. BLS report showed that both headline and core consumer inflation rates rose slightly in February. This indicates that inflation continues to remain stubborn in the U.S. and that the Fed will now have to wait longer before starting to cut rates.

In other news, a U.S. Department of Labor report showed that the number of people claiming unemployment benefits in the U.S. fell by 1,000 to 209,000 in the week ended March 8, 2024, below market expectations of 218,000. The substantial job numbers match last week's NFP numbers in underscoring the historical tightness of the U.S. labor market, adding leeway for the Federal Reserve to prolong its hawkish stance into 2024, if necessary, to lower inflation.
Elsewhere, a U.S. Census Bureau report showed consumer spending at the retail level rose to 0.6% month-over-month in February 2024, following an upwardly revised 1.1% fall in January and below market forecasts of a 0.8% gain. Excluding food services, auto dealers, building materials stores and gasoline stations, the so-called core retail sales used to calculate GDP were flat.
Gainers and Losers
Here are the top US500 index movers today before the bell. This is a week in which the primary index is set to close with modest gains.
Top Gainers⚡
The top performers on the US500 Index were:
- West Pharmaceutical Services, Inc. (NYSE: WST) rose 3.55%/13.68 points to trade at $399.43 per share.
- Haliburton, Inc. (NYSE: HAL) added 3.01%/1.10 points to trade at $37.63 per share.
- Alphabet C, Inc. (NASDAQ: GOOG) gained 2.54%/3.57 points to trade at $144.34 per share.
Top Losers💥
The worst performers on the US500 Index were:
- Lennar, Corp. (NYSE: LEN) lost 7.64%/12.64 points to trade at $152.86 per share.
- Enphase Energy, Inc. (NASDAQ: ENPH) declined 6.57%/7.76 points to trade at $110.41 per share.
- V.F. Corp. (NYSE: VFC) shed 5.77%/0.89 points to trade at $14.61 per share.
As we advance, investors now look forward to second-tier U.S. economic news data featuring N.Y. Empire State Manufacturing Index (Mar) and Industrial Production (MoM) (Mar) data reports. The data might influence the USD price dynamics, which, along with the broader market risk sentiment, should allow traders to grab some short-term opportunities around the US500 Index. The main focus, however, remains on next week's Fes interest decision.
Technical Outlook: One-Day US500 Index Price Chart
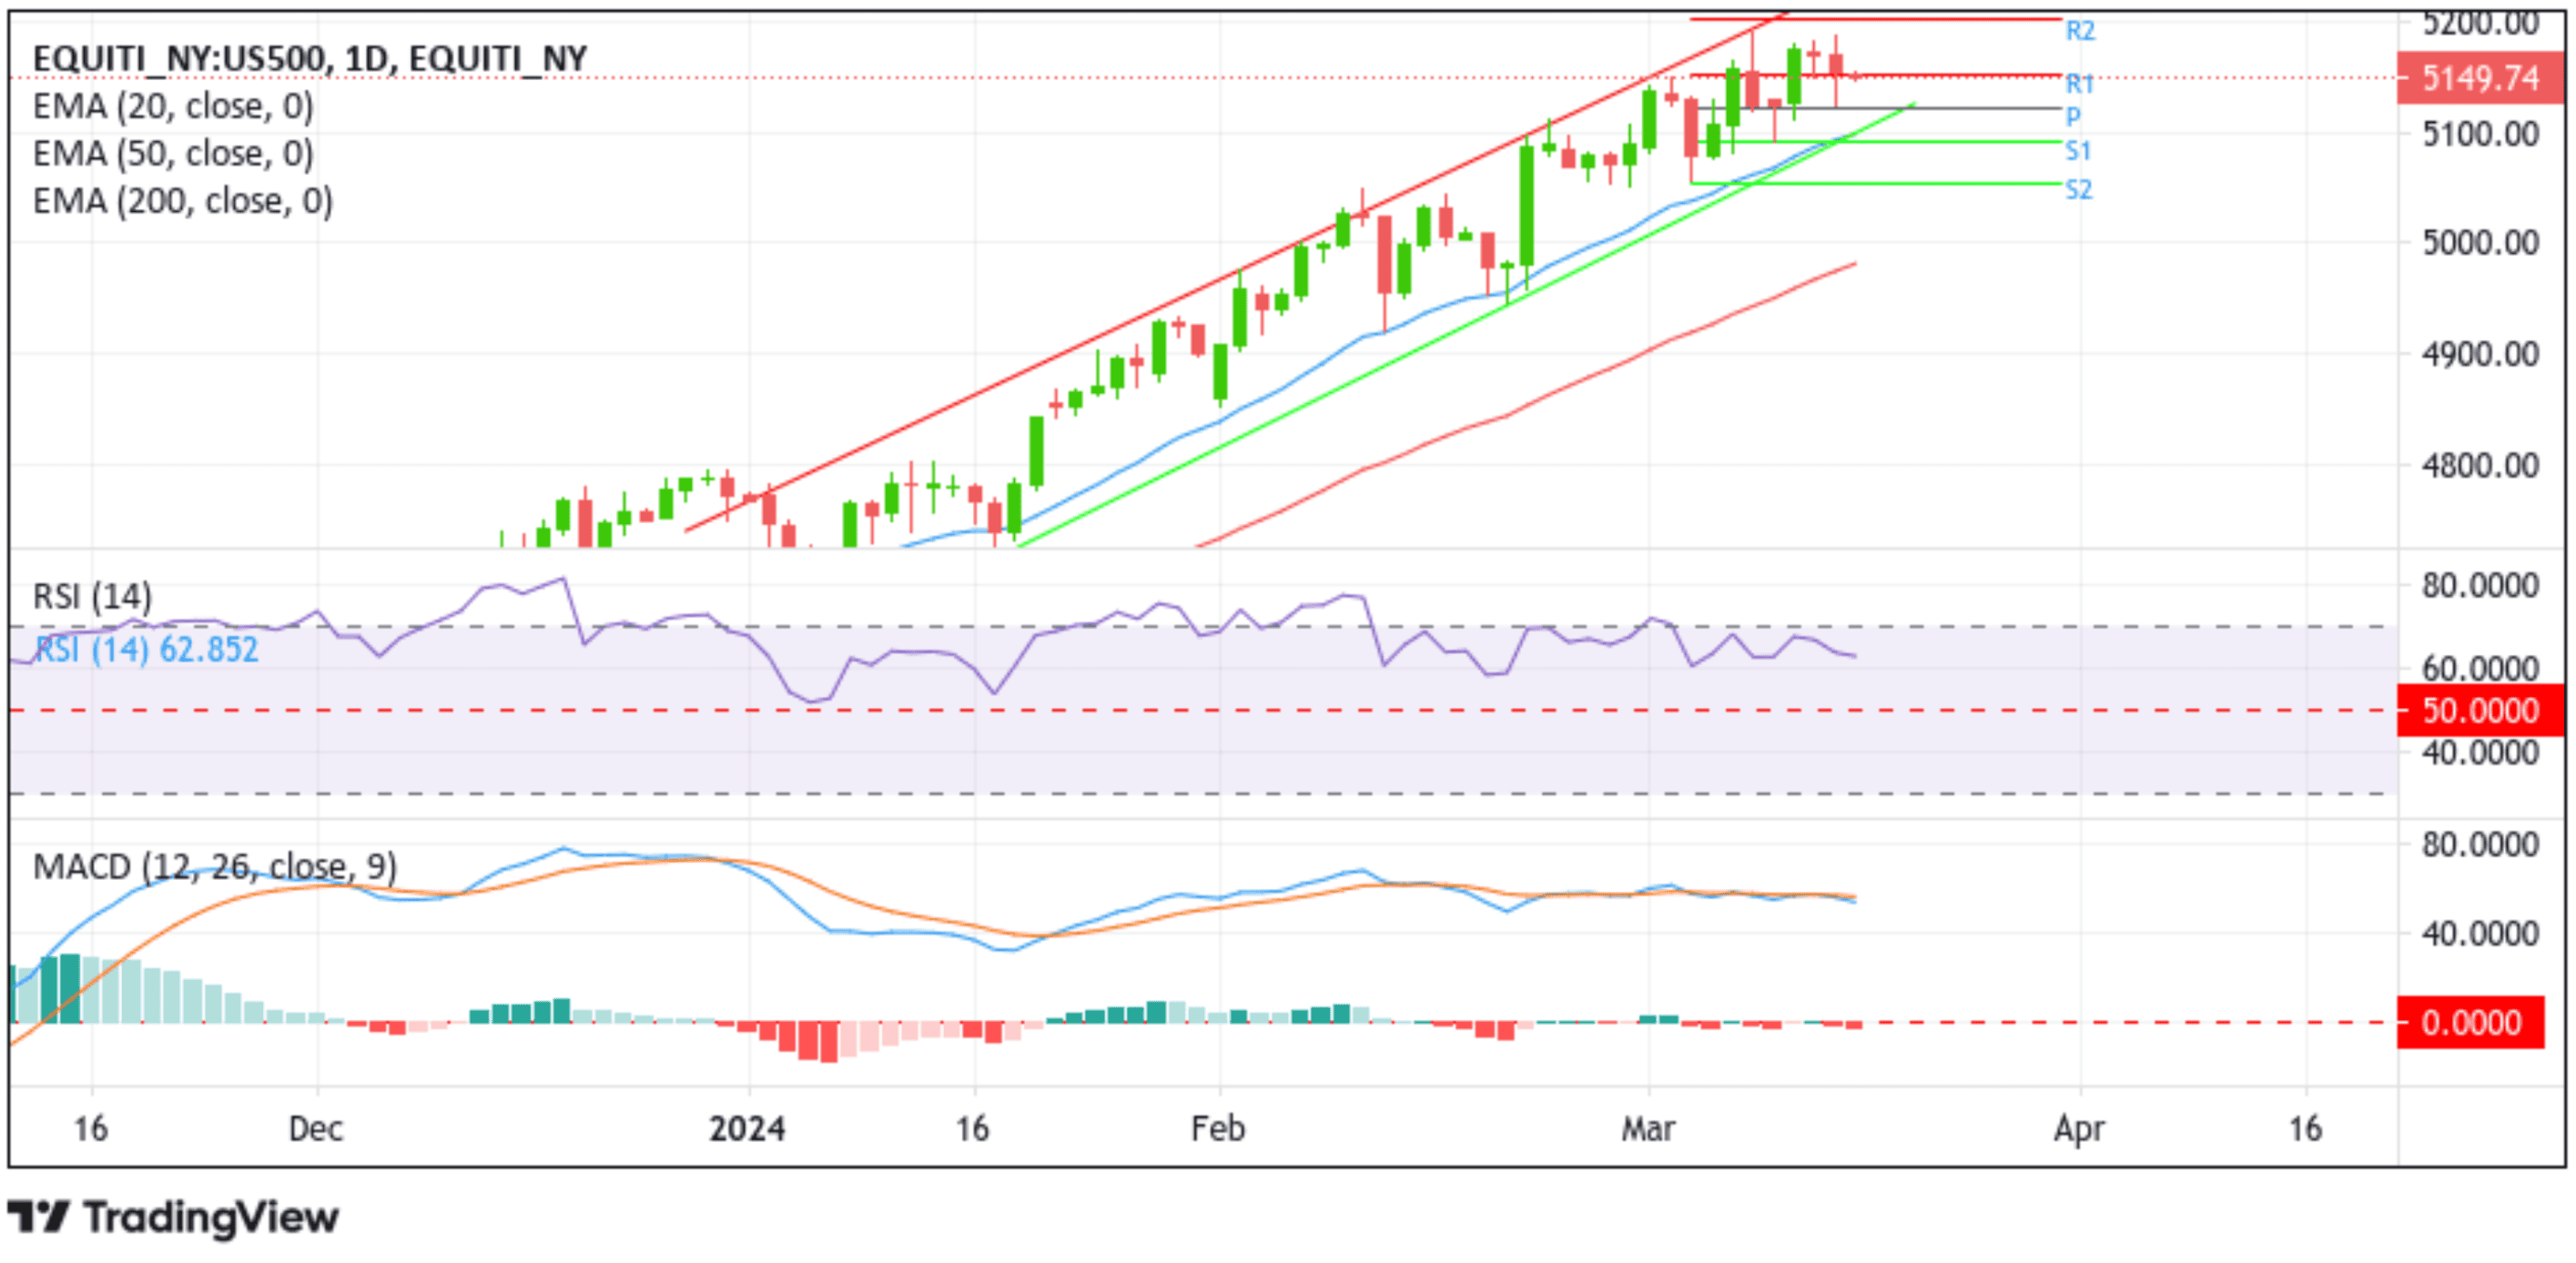
Looking at the US500's index one-day price chart, the price is currently tagged below a crucial resistance level/ 5149.40 level following a corrective slide from the vicinity of $5189.3, or All-time High (ATH). For further confirmation of the extension of the bearish trajectory, the US500 price has to drop further toward the pivot level at $5121.71, which coincides with the previous day's YTD low, and flip it before descending further to retest the multi-week ascending trend-channel support. This may not have further selling below this level or a subsequent break below this key support level, considering how the price has reacted to this level (The price has rebounded three times in the past two months).
Moreover, by the time the price touches this level, it will find heavy support from the moving averages (20, 50, and 200) and more so from the technical oscillators (RSI and MACD), which all point to a bullish outlook and hence will help prevent further selling below this level.
If dip-buyers return and catalyze a bullish reversal, initial resistance appears at the 5149.40 level (R1). A clean move above this level will pave the way for a rise toward the $5189.3 level, or All-time High (ATH). On Thursday, the Bulls attempted to break above this level in pre-trading hours and record a new All-time High (ATH), but their efforts bore no fruit. That said, the $5189.3 level now acts as a heavy barricade, and traders should wait for solid follow-through buying above this level before positioning for further buying around the main index.