AUD/USD Seeks Firm Direction Amid A Bullish Open Gap, Focus Shifts To RBA Interest Rate Decision


- NZD/USD pair opens on Monday with a gap down but has managed to correct higher and away from the January low of 0.6689
- Declining Treasury Bond yields, along with a weaker risk tone, undermined the safe-haven greenback
- Firm Chinese Manufacturing PMI data continue to underpin the Aussie dollar
- The focus shifts to tomorrow's RBA interest rate decision ahead of the Fed Chair testimony and February jobs data

AUD/USD Pair came around renewed buying pressure on Monday despite opening with a gap down (bullish open) to lift off spot prices from the 0.67416 level and correct higher and away from the January low of 0.6689. This marks the third day of a positive move in the last seven days, and the pair looks set to extend the intraday recovery mood beyond the 0.67838 monthly high last touched the previous week on Wednesday.
Declining Treasury Bond yields and a weaker risk tone undermined the safe-haven greenback and helped exert downward pressure on the GBP/USD pair. A positive manner around the U.S. equity markets was another factor that weighed on the buck. Additionally, market investors have decided to wait on the sidelines. They await the testimony from Federal Reserve Chair Jerome Powell this week, and the February jobs report that will likely influence how hawkish the U.S. central bank will be.

The U.S. Dollar index (DXY), which measures the value of USD against a basket of currencies, weakened in early Asian trade on Monday and fell 0.06% to trade at $104.466, but not far off a seven-week high of 105.36 it touched last week.
An ISM report last Friday showed little signs that the significant rebound in January was a one-off, with the headline ISM Non-Manufacturing PMI for February falling to 55.1, little changed from 55.2 in January, and above expectations of 54.5. Faster increases were seen for new orders (62.6, the highest since November 2021 vs 60.4 in January), new export orders (61.7 vs 59), and employment (54, the highest since December 2021 vs 50).
As a leading indicator for this week's payrolls for February, it's a further indication that the U.S. labor market remains resilient, adding additional market expectations that the Fed will stick to high-interest rates to tame inflation in the U.S.
CME's Fed watch tool is now showing 75.3% of market participants are pricing in a likelihood of a 25bps interest rate hike lifting the Fed target range to 5.00%, while 24.7% are pricing in a likelihood of a 50bps interest rate hike raising the Fed target range to 5.25%.
Additionally, the latest Fed Minutes report showed that policymakers largely agreed to keep raising interest rates further to bring inflation back within target. Furthermore, a slew of Fed officials last week were vocal in their stance against fighting inflation through interest rate hikes. Minneapolis Fed President Neel Kashkari said he would consider a 50 basis point rate hike on Wednesday. At the same time, Atlanta Fed President Raphael Bostic on Thursday advocated for continued 25 basis point increases.

Shifting to the Aussie docket, the Aussie dollar continued to be supported by Firm Chinese Manufacturing PMI data released last week which showed China's manufacturing activity had expanded at its fastest pace since April 2012 last month. Additionally, market expectations that the Reserve Bank of Australia (RBA) will stick to high-interest rates in its monetary policy decision tomorrow offered some support to the Aussie dollar.
As we advance without significant moving economic data from both dockets, the focus shifts to tomorrow's RBA interest rate decision. The Central Bank is expected to hike its interest rates by 25bps lifting its overall cash rate to 3.60%.

Technical Outlook: NZD/USD Four-Hours Price Chart

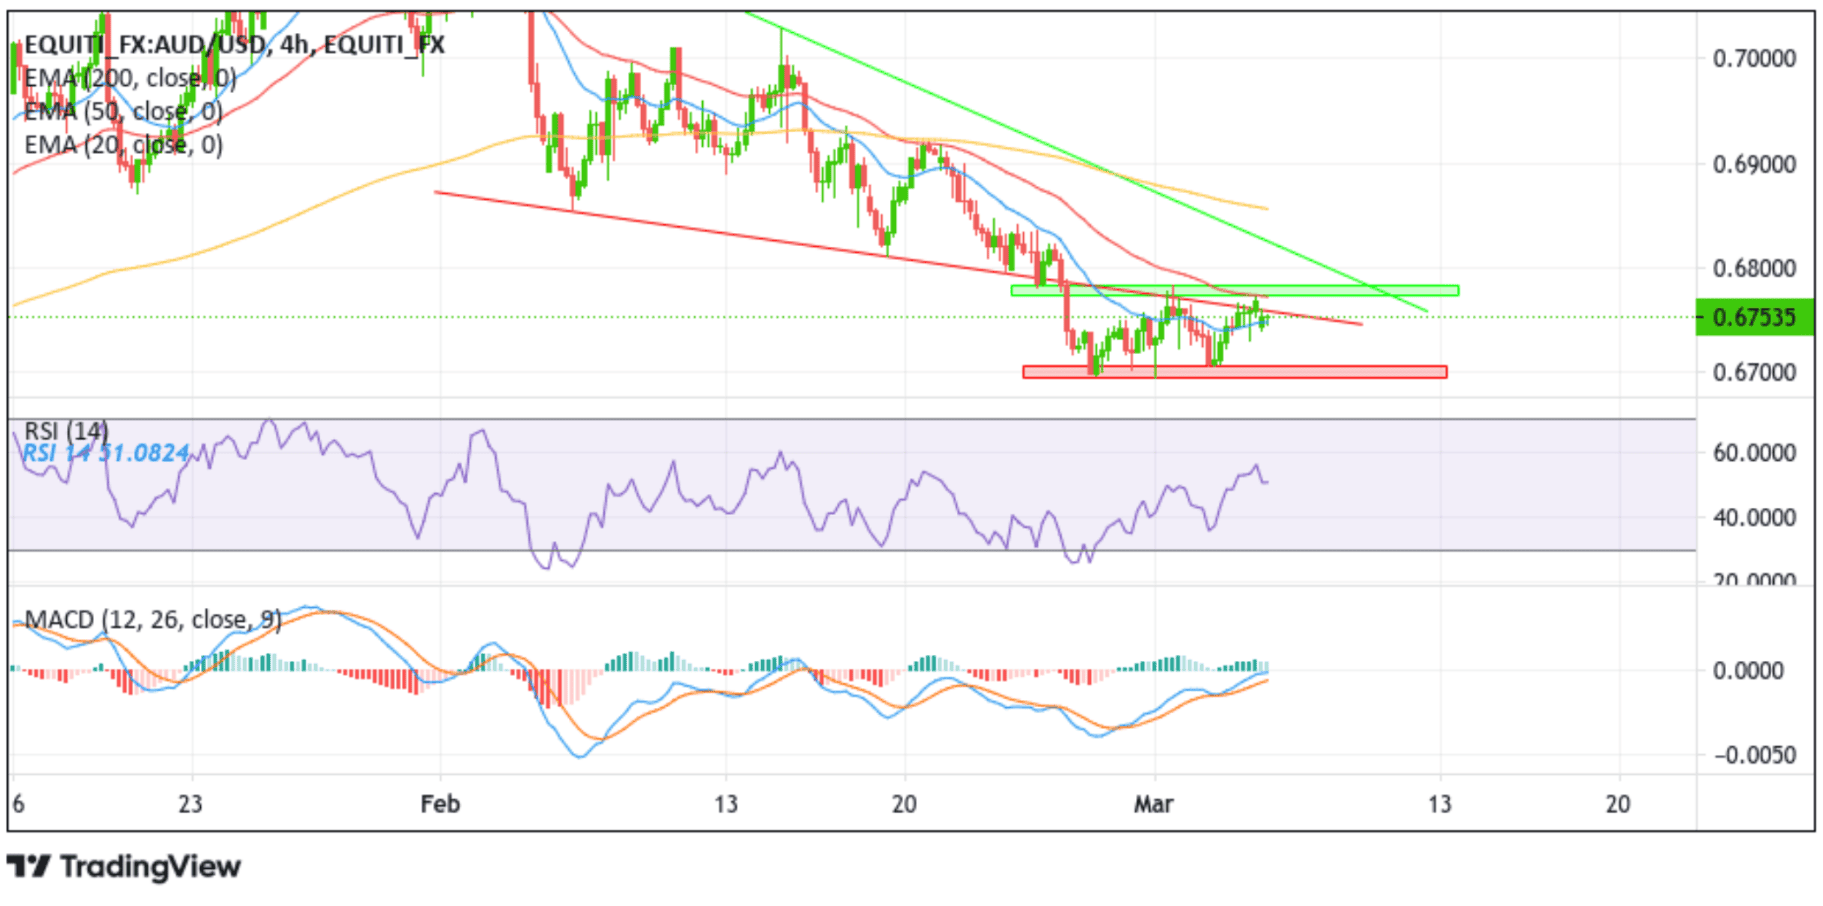
From a technical standstill using a four-hour price chart, the price opened on Monday in a firmer responsive bullish move by market participants after a gap-down (bullish open gap) denoting a bargain buy for investors. Some Sustained strength would be met by initial resistance at the key resistance level plotted by a downward-sloping trendline extending from the early February 2023 swing low. If buyers manage to pierce this barrier, buying interest could gain momentum but would be met by stiff resistance from key supply zone ranging from 0.67740 - 0.67840 levels, preventing further uptick. It is worth noting the latter (0.67840) coincides with the 50 (red) Exponential Moving Average (EMA).
The MACD oscillator on the four-hour chart is still holding in the negative territory, pointing to a sign of bearish price action and the current uptick risks chances of fizzling out. The bearish bias is further supported by the acceptance of the price below the 200 (yellow) Exponential Moving Average (EMA) at the 0.68586 level. The 20 and 50 Exponential Moving Average (EMA) crossover (Golden cross) at 0.69303 level validates the bearish credence.
If dip-sellers and technical traders jump in and spark a bearish turnaround, the price will first find support at the 0.67059 - 0.66944 key demand zone. If sellers manage to breach this barricade, downside pressure could accelerate, paving the way for a drop toward retesting the 0.66868 key support level. On further weakness, the focus shifts towards the 0.66689 - 0.66752 key demand zone.
