AUD/USD Holds Below 0.68000 Mark Amid Fresh USD Demand, RBA Interest Rate Decision Eyed


- AUD/USD pair attracts fresh selling on Tuesday and extends overnight rebound from the 0.67934 level
- A fresh leg up in the U.S. Treasury Bond Yields triggers some USD Buying in turn caps AUD/USD against further upside move
- A slew of positive Aussie microdata gets overly overshadowed by a strong U.S. Dollar and dovish market expectations on RBA Interest rate decision
- The Reserve Bank of Australia is expected to leave its official cash rate unchanged at 3.6%

AUD/USD cross extended the overnight rebound from the vicinity of 0.67934 level. It dragged spot prices to a fresh daily low around the 0.677758 - 0.67743 region in the last hour of the second part of the Asian session amid renewed U.S. Dollar buying. A fresh leg up in the U.S. Treasury Bond Yields on Tuesday and a softer risk tone offered some support to the safe haven-green back. Apart from this, the underlying bullish solid sentiment surrounding the U.S. Dollar kept the U.S. Dollar bulls on the defensive and acted as a headwind for AUD/USD pair.
The U.S. Dollar index(DXY), which measures the value of USD against a basket of currencies, rebounded from the vicinity of $102.006 level and gained 0.18%/188 points to trade at $102.188 on Tuesday during the early Asian session buoyed by inflation concerns as a result of rising Oil prices following the surprise OPEC + cuts move over the weekend.

The surprise OPEC+ Cuts move over the weekend to cut oil production by just over 1 million barrels per day sent oil prices soaring, igniting inflation pressures that markets feel could prompt the U.S. Federal Reserve to lift interest rates at its next meeting. This view changed the overall risk sentiment, evident from a weaker tone around the equity markets, which extended some support to the safe-haven greenback and prompted some profit-taking around the AUD/USD pair.
Fed funds futures traders are now pricing a 58.1% chance of a 50bps interest rate hike by the FED in its next monetary policy meeting, up from 40.2% last week, as seen by CME’s Fed watch tool. It was worth noting a few weeks ago, investors were pricing in a greater chance of the Fed hiking its interest rates by a smaller rate hike in its next meeting following the Banking crisis that had threatened to hit economic activities in major economies worldwide. This view was given a degree of credence after data on Friday showed U.S. consumer spending rose only moderately in February after surging the prior month, with inflation showing some signs of cooling.
This came from disappointing US PMI data released on Tuesday, which showed U.S. Factory Activity Falls for the 5th month. The ISM Manufacturing PMI decreased to 46.3 in March of 2023, the lowest since May of 2020, compared to 47.7 in February and a consensus of 47.5, implying that rising interest rates and growing recession fears are starting to weigh on businesses. The reading pointed to a fifth straight month of contraction in factory activity as companies continue to slow outputs better to match the demand for the first half of 2023 and prepare for growth in the late summer/early fall period.

Shifting to the Aussie docket, Australian Bureau of Statistics (ABS) data on Tuesday showed Retail sales in Australia grew by 0.2% month-over-month to AUD 35.14 billion in February 2023, unrevised from the preliminary reading. Additionally, the value of new home loans for owner-occupied homes in Australia fell 1.2% MoM to A$15 billion in February 2023, declining for the ninth consecutive month but coming in better than forecasts for a 3% drop, according to ABS data on Tuesday. Furthermore, the seasonally adjusted estimate for total dwellings approved in Australia rose by 4.0 percent month-over-month to 12,661 units in February 2023, swinging from a downwardly revised 27.1 percent slump a month earlier, an ABS flash data showed on Tuesday.
That said, a generally strong U.S. Dollar heavily overshadowed the combination of positive microdata. Apart from this, market expectations that the Reserve Bank of Australia, in its interest rate decision announcement later today, will leave its official cash rate unchanged at 3.6% acted as a headwind to the Aussie dollar and helped cap the AUD/USD against further uptick.
As we advance, investors look forward to the Aussie docket featuring the release of the RBA Interest rate decision. Investors will look for cues from the release of the U.S. JOLTs job opening data, which is lower than 10.4M, down from 10.824 M.
Technical Outlook: Four-Hours AUD/USD Price Chart
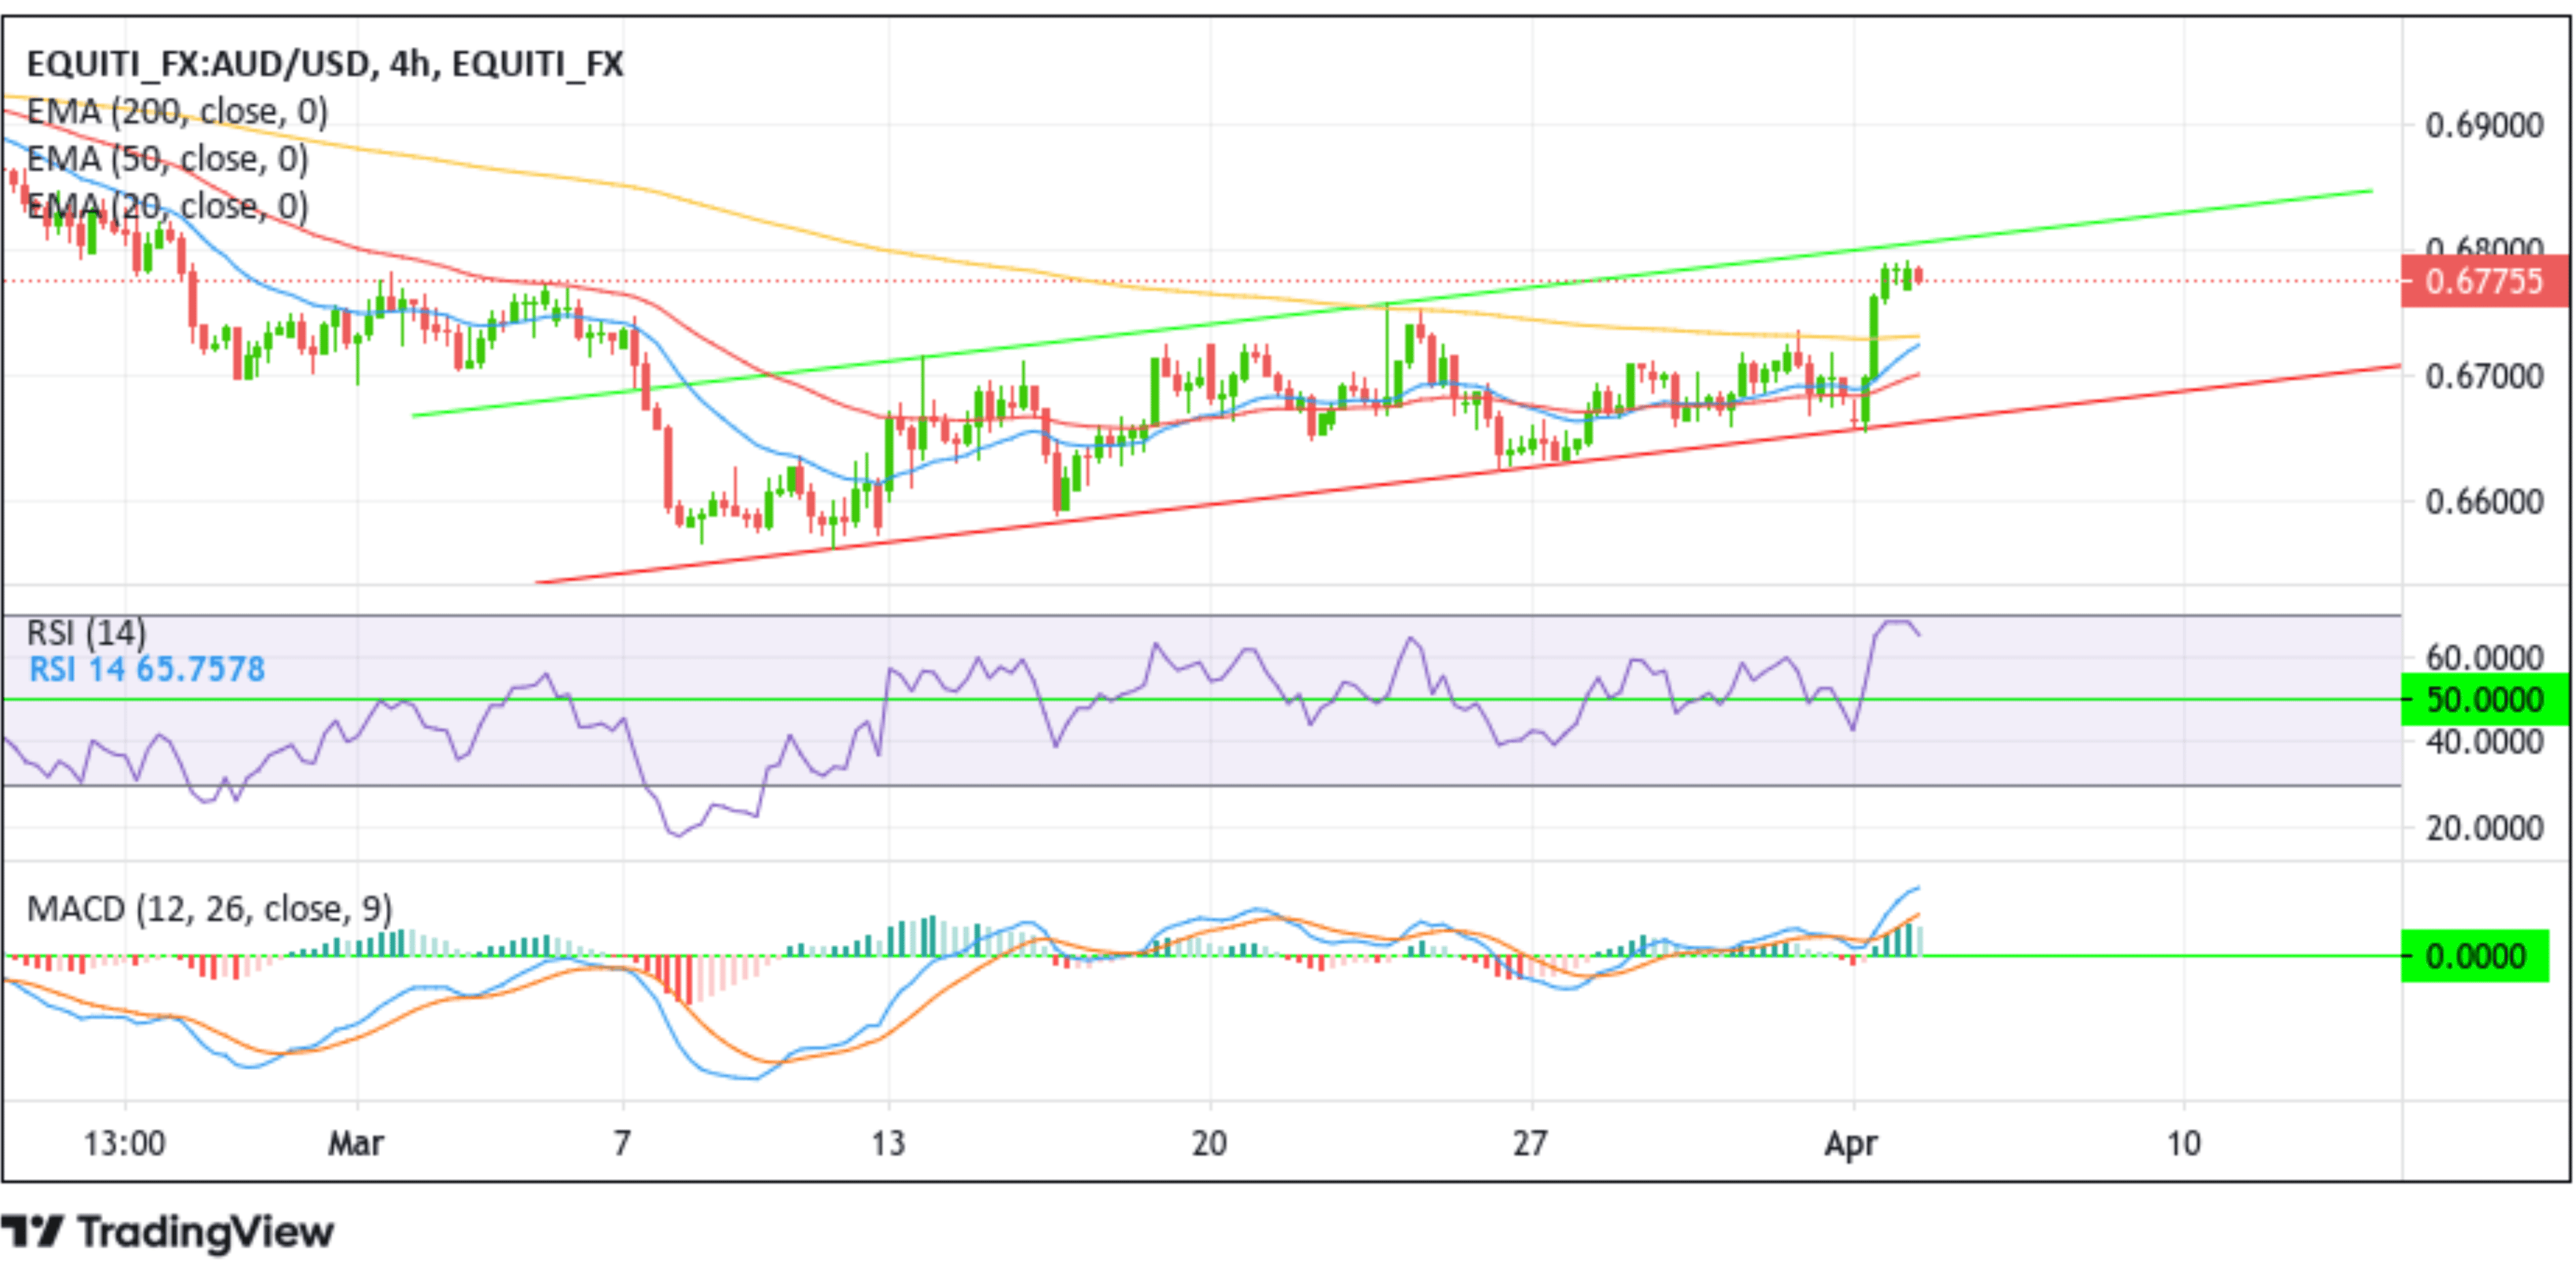
From a technical standstill, the price rebounded from the vicinity of 0.67934 level, which sits below a crucial resistance level plotted by an ascending trendline extending from the mid-March 2023 swing high. Suppose AUD/USD Bulls give in to the selling pressure, we could see AUD/USD pair weaken and drop to the demand zone ranging from 0.67546 - 0.67581 levels. Flipping this barricade into a supply zone would pave the way for a further downside move toward tagging the technically strong 200 (yellow) EMA level at 0.67308. A four-hour close below this hurdle would invalidate the bullish bias and pave the way for further losses. The southside move could then accelerate towards revisiting the 0.67252 resistance level, which coincides with the 20 EMA level. A break below this level would pave the way for increased technical selling around the AUD/USD pair.
All the technical Oscillators in the chart are holding a dip in the bullish territory as both the RSI (14) and MACD crossover are above their signal lines, indicating a bullish sign of price action this week. The bullish outlook is validated by accepting the price above the technically strong 200 EMA (yellow) at the 0.67308 level. Additionally, the 20 (blue) and 50 (red) EMA Crossover at the 0.66749 level adds credence to the bullish thesis.
On the flip side, suppose dip-buyers and tactical traders immediately trigger a bullish reversal. In that case, initial resistance appears at the crucial resistance level plotted by an ascending trendline extending from the mid-March 2023 swing high. Sustained strength above this barrier (bullish price breakout) would negate any near-term bearish outlook and pave the way for aggressive technical buying around the AUD/USD pair. The Bullish momentum could then accelerate toward testing the 0.68538 resistance level last touched on 17th February 2023. A decisive flip of this level into a support level would pave the way for additional gains around the AUD/USD pair.
