AUD/USD Sinks Further Below Mid-0.66000s On Downbeat Australia Job Numbers, A Slew Of US Macro-data Awaited


- AUD/USD cross drops close to a two-week low/0.66293 level amid a generally stronger U.S. dollar
- Downbeat Australia Job numbers are a headwind to the Aussie dollar, helping keep the AUD/USD cross depressed below mid-0.66000s
- The modest downtick in U.S. Treasury bond yields, plus the hawkish RBA Meeting minutes, might help limit further AUD/USD losses
- Investors look forward to a slew of key U.S. macroeconomic data for fresh directional impetus

AUD/USD pair extended the overnight pullback from the vicinity of 0.66742 - 0.66678 region and witnessed selling for the second consecutive session on Thursday. The momentum dragged spot prices back to near a two-week low/0.66293 level touched earlier in the session and looked set to maintain its bid tone heading into the European session.
A combination of factors provided a modest intraday lift to the U.S. dollar, which helped exert downward pressure on the AUD/USD pair. Firm market expectations that the Fed will maintain its hawkish stance in its next monetary policy meetings turned out to be another factor that drove flows away from the risk-sensitive Aussie dollar toward the greenback. In fact, on Tuesday, Cleveland Federal Reserve President Loretta Mester said that interest rates are not at a sufficiently restrictive level and that the central bank still needs to be at the spot to hold rates. This, in turn, cemented market expectations of a hawkish Fed at the next monetary policy meeting. Apart from this, signs of a potential recession in the U.S., sticky inflation, and more robust job growth remain supportive of the greenback, suggesting the downside is the path of least resistance for the shared currency. Further contributing to the sentiment surrounding the AUD/USD pair was the positive progress of the debt ceiling negotiations on Tuesday, with a possible deal expected to be reached by the end of the week.

Additionally, softer Chinese macroeconomic readings this week showed the world's second-largest economy's post-Covid rebound had stalled, adding to worries about a global economic downturn.
In other news, an Australian Bureau of Statistics report on Thursday showed full-time employment fell by 27,100 to 9,726,500 last month while part-time employment grew by 22,800 to 4,1556900. Additionally, the Employment change fell to -4.3K in April, down from 61.1K, while the Unemployment rate surged to 3.7% in April, up from 3.5% in March. Despite the combination of negative factors, the modest downtick in U.S. Treasury bond yields might hold investors back from placing aggressive bearish bets. Apart from this, the Minutes of the Reserve Bank of Australia Monetary Policy Meeting held on May 2, released on Tuesday, showed that further increases in interest rates may be required to bring inflation back to the central bank's target.
As we advance, investors look forward to the U.S. docket featuring the release of the May Philadelphia Fed Manufacturing Index data report, which is higher at -19.8, up from -31.3 in April. Investors will look for cues from the release of the Initial jobless claims data report for last week, which is lower at 254K, down from 264K the week earlier. Additionally, investors will look for directional impetus from the release of the Existing home sales data report for April, which is lower at 4.30M, down from 4.44M in March.
Technical Outlook: Four-Hours AUD/USD Price Chart
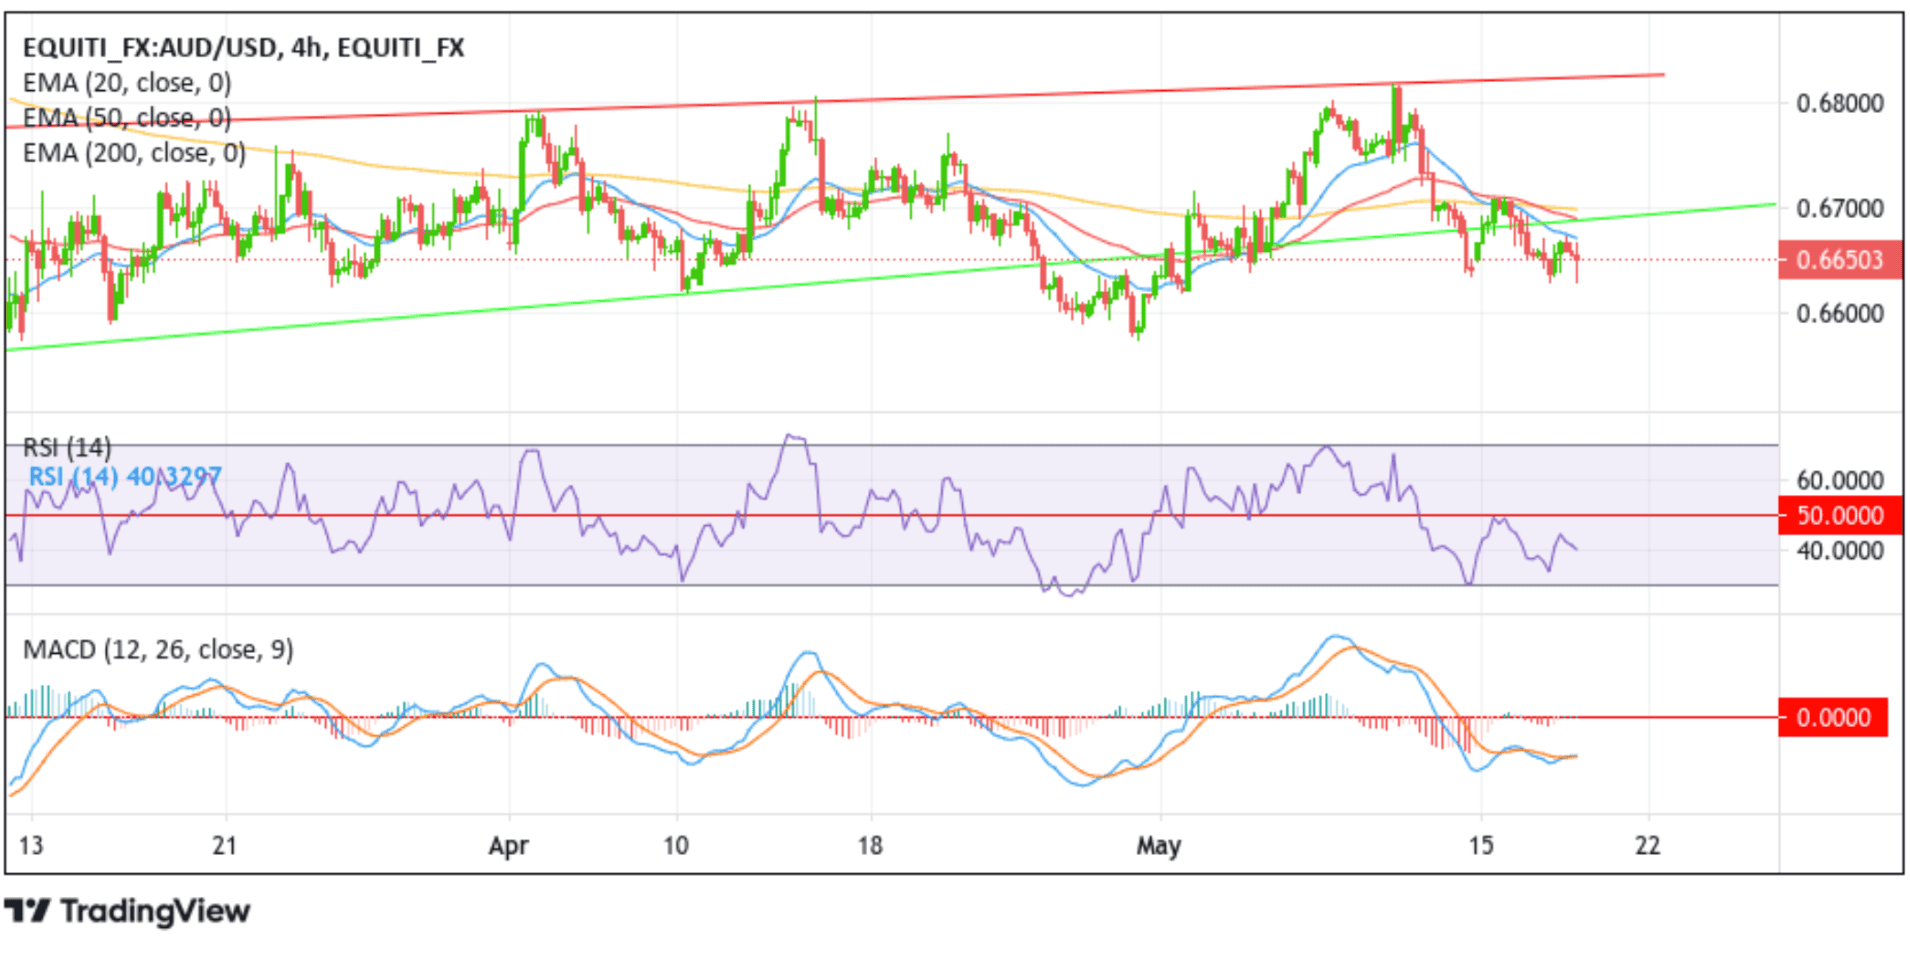
From a technical perspective, the price's ability to break below the key support level plotted by a horizontal trendline extending from the early March 2023 swing low, followed by the price's rejection below the 20-day (blue) Exponential Moving Average (EMA) at 0.66731 level following a minor rebound, supported the case for further downside moves. Some follow-through selling beyond the current price level would drag spot prices toward the key demand zone ranging from 0.66284-0.66213 levels. Sustained weakness below this zone could pave the way for a drop toward confronting the 0.65731 support level. A decisive flip of this support level into a resistance level could pave the way for further losses around the AUD/USD pair.
On the flip side, if dip-buyers and tactical traders jump back in and trigger a bullish reversal, initial resistance appears at the 20 (blue), 50 (red), and 200 (yellow) days Exponential Moving Averages (EMA) at 0.66731, 0.66879 and 0.66981 levels, respectively. Suppose sidelined buyers join in from this seller congestion zone. In that case, it will rejuvenate the bullish momentum, provoking an extended rally beyond the key support level plotted by a horizontal trendline toward the 0.67442 - 0.67758 supply zone and, in highly bullish cases, retest the key resistance level devised by a horizontal trendline extending from the early April 2023 swing high.
