GOLD Pares US-CPI Inspired Gains And Slides Back Below $2030.00 An Ounce, US PPI Data Eyed


- Gold came under fresh selling during the mid-Asian sessions and was pressured by various factors.
- Rising treasury bond yields and a modest U.S. dollar rebound are headwinds to the precious yellow metal.
- Markets await the release of the PPI data, which is expected to show rising inflation pressures in the U.S.

Gold slipped slightly lower on Thursday during the mid-Asian session after struggling to capitalize on the overnight bounce from the 2027.860 level in the aftermath of the latest US CPI reading report. As per press time (06:00 UTC+3), the precious yellow metal was down 0.14% /283.4 points at $2032.67 per ounce, weighed down by a modest U.S. dollar rebound supported by rising treasury bond yields as investors continue to bet that the Fed is less likely to halt its aggressive tightening campaign any time soon following the latest US CPI readings.
A US Bureau of Labor Statistics (BLS) report on Wednesday showed the annual inflation rate in the U.S. fell to 4.9% in April 2023, the lowest since April 2021, and below market forecasts of 5%. Compared to the previous month, the CPI rose 0.4%, much higher than 0.1% in March but matching market expectations. Excluding food and energy, the annual Core CPI rate in the U.S. ticked down to 5.5% in April 2023, as expected, from 5.6% in the prior month, amid a downtick in the cost of rent. Every month, core consumer prices rose by 0.4% from earlier in April, the same pace as in March, in line with market expectations. The US CPI figures come days after another BLS report showed a resilient job market in the U.S. following a stronger-than-expected job growth in April. These, plus rising interest rate hikes, fears of a potential recession in the U.S., and renewed concerns about the U.S. banking sector, continue to act as a tailwind to the greenback. They should limit any meaningful uptick in Gold prices, at least temporarily.

Further contributing to the offered tone surrounding the XAU/USD pair is the recent hawkish comments by Top Fed officials who spoke vocally on interest rates and Inflation in the U.S. In prepared remarks at the Economic Club of New York on Tuesday, New York Fed President John Williams suggested that rates could go higher still if inflationary pressures do not ease. "We haven't said we're done raising rates," he said. In turn, the treasury bond yields rose on Tuesday, further offering support to the greenback and driving flows away from the yellow metal. That said, Fed Fund futures traders are now seeing pricing almost a 90% chance of a 25bps interest rate hike during the June meeting before the Fed pivot, according to the CME's FedWatch Tool. Still, almost 10% of traders are pricing in a surprise 50bps interest rate hike.
As we advance, investors look forward to releasing the U.S. Producer Price Index (PPI) data report for May, which is expected to show rising inflation in the U.S. by rising to 0.3% from -0.5% last month. Investors will look for cues from the release of the U.S. Initial Jobless Claims data report for this week, which is higher at 245K, up from 242K last week. The data reports will influence the U.S. dollar's dynamics and provide directional impetus to the XAU/USD pair.
Technical Outlook: Four-Hours Gold Price Chart
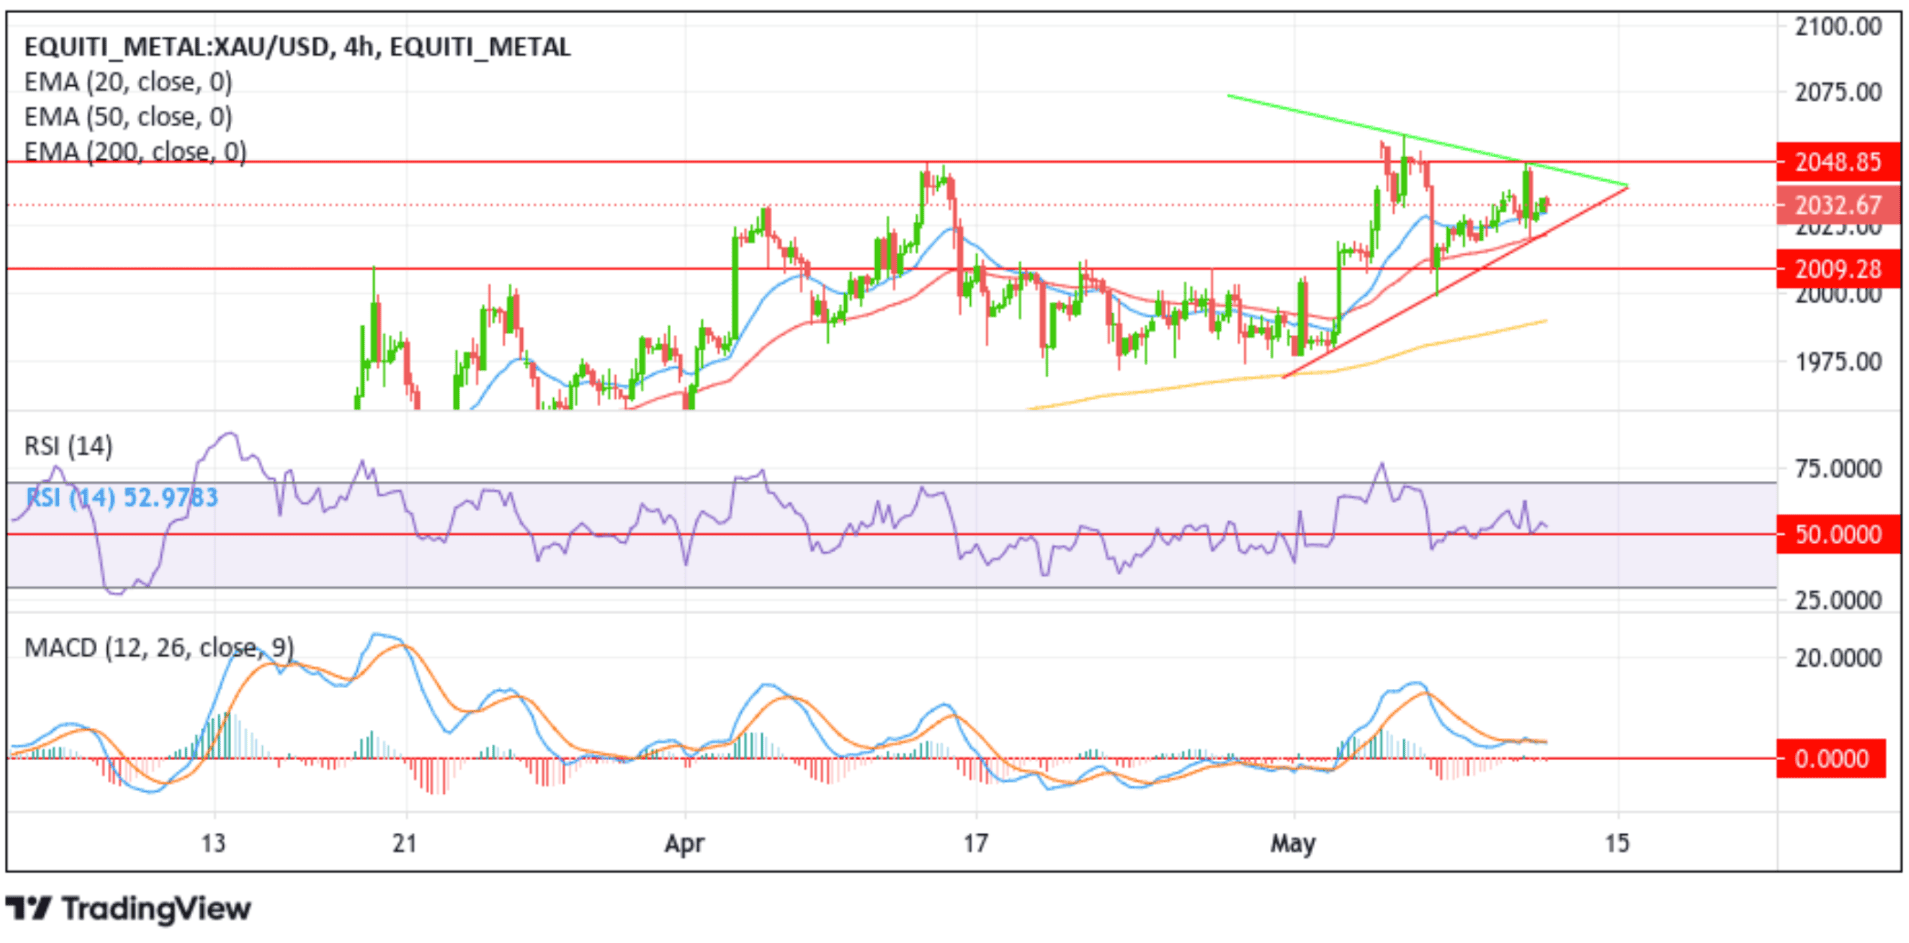
From a technical standpoint, an increase in selling pressure would face initial resistance at the 20-day (blue) and 50-day (red) Exponential Moving Average (EMA) at 2029.953 and 2022.297 levels, respectively. Suppose sidelined sellers join in from this buyer congestion zone. In that case, it will rejuvenate the bearish momentum, provoking an extended fall beyond the key support level plotted by an ascending trendline from the early-May 2023 swing low. The bearish trajectory could then be extended toward the 2009.28 support level. A decisive flip of this support level into a resistance level would pave the way for an extended decline toward the 2000.00 psychological mark.
On the flip side, if dip buyers resurface and spark a bullish reversal price will face initial resistance at the key resistance level plotted by a descending trendline extending from the early-May 2023 swing high. Sustained strength above this would pave the way for an extended rally above the 2048.917 resistance level towards May 2023 swings high at 2067.853.

