USD/CNH Steadily Climbs Back Above 6.8900s Amid Modest USD Rebound, 20 And 50 EMA Lurking In The Background


- USD/CNH cross attracted some dip buying on Thursday and extended the modest rebound above 6.89000s
- Renewed U.S. Dollar demand amid expectations interest rates will stay elevated for some time cap the USD/CNH against further downtick
- China's Factory output smashes forecasts with decade-high growth, in turn, offered some support to the Yuan
- US manufacturing activity contracted in February, according to a report by Markit, in turn, undermined the greenback

USD/CNH pair witnessed aggressive buying during the early Asian session amid increased demand for the buck. Following a modest rebound around the 6.86348 - 6.86823 region on Wednesday during the early North-American session, the asset met fresh demand for the second day on Thursday. It lifted spot prices to the late 6.89000s.
Rising treasury bond yields, along with a softer risk tone around the U.S. equity markets, offered some support to the greenback and helped to exert upward pressure on the pair as investors continue to bet the recent strong inflation data plus the latest Feds Minutes report will make the U.S. Central bank stick to aggressive interest rate hikes to tame inflation in the U.S.

Aside from that, hawkish comments from top Fed officials about the Fed's monetary policy were seen as another factor that triggered higher treasury bond yields, with the most recent remarks coming from Minneapolis Federal Reserve President Neel Kashkari, who said on Wednesday that he's "open to the possibility" of a more considerable interest rate increase at this month's policy meeting, "whether it's 25 or 50 basis points," but hasn't made up his mind.
The U.S. Dollar index (DXY), which measures the value of the United States dollar relative to a basket of foreign currencies, strengthened against a basket of other currencies on Thursday and was up 0.17% for the day to trade at $104.560 buoyed by views that interest rates will stay elevated for some time as inflation remains stubbornly high. At the same time, recession fears kept investors on edge.
However, the U.S. Dollar index fell on Wednesday after a manufacturing report from Markit and the Institute for Supply Management (ISM) revealed that U.S. manufacturing activity shrank in February. The closely watched ISM Manufacturing Index registered a 47.7% reading, representing the percentage of companies reporting expansion. A reading below 50% symbolises contraction. Additionally, a Markit report on Wednesday showed the S&P Global Manufacturing PMI for the U.S. was revised lower to 47.3 in February of 2023 from a preliminary of 47.8 compared to 46.9 in January. The reading showed manufacturing activity shrank for a fourth consecutive month amid further output and new orders contractions, although rates slowed in both instances.

The Chinese Yuan, on the other hand, gained on Wednesday after a Caixin and China National Bureau of Statistics (NBS) manufacturing report showed China's manufacturing activity had expanded at its fastest pace since April 2012 last month. The keenly watched Caixin China General Manufacturing PMI increased to 51.6 in February 2023 from 49.2 in January, above the market consensus of 50.2. This was the first increase in factory activity since last July, and the highest reading in 8 months, after a shift in COVID policy. The official NBS Manufacturing PMI also increased to 52.6 in February of 2023 from 50.1 in the previous month, exceeding market estimates of 50.5.
In other news, China's Non-manufacturing PMI also grew to 56.3 from January's print of 54.4, when it saw a sharp improvement backed by a recovery in services and construction activity. Commenting on the reports, "The data confirms expectations that the growth outlook has improved quite significantly in China, so it's positive for risk sentiment," said Niels Christensen, chief analyst at Nordea. "The broad-based obvious improvements for both Manufacturing and non-Manufacturing PMIs in February reflect the solid momentum of post-reopening recovery," economists at Citi further said in a note.
As we advance, investors look forward to the U.S. docket featuring the release of the Initial Jobless Claims data seen higher at 195K from 192K in the previous week. The data report would influence U.S. Dollar price dynamics and allow traders to grab some trading opportunities around the USD/CNH Pair.

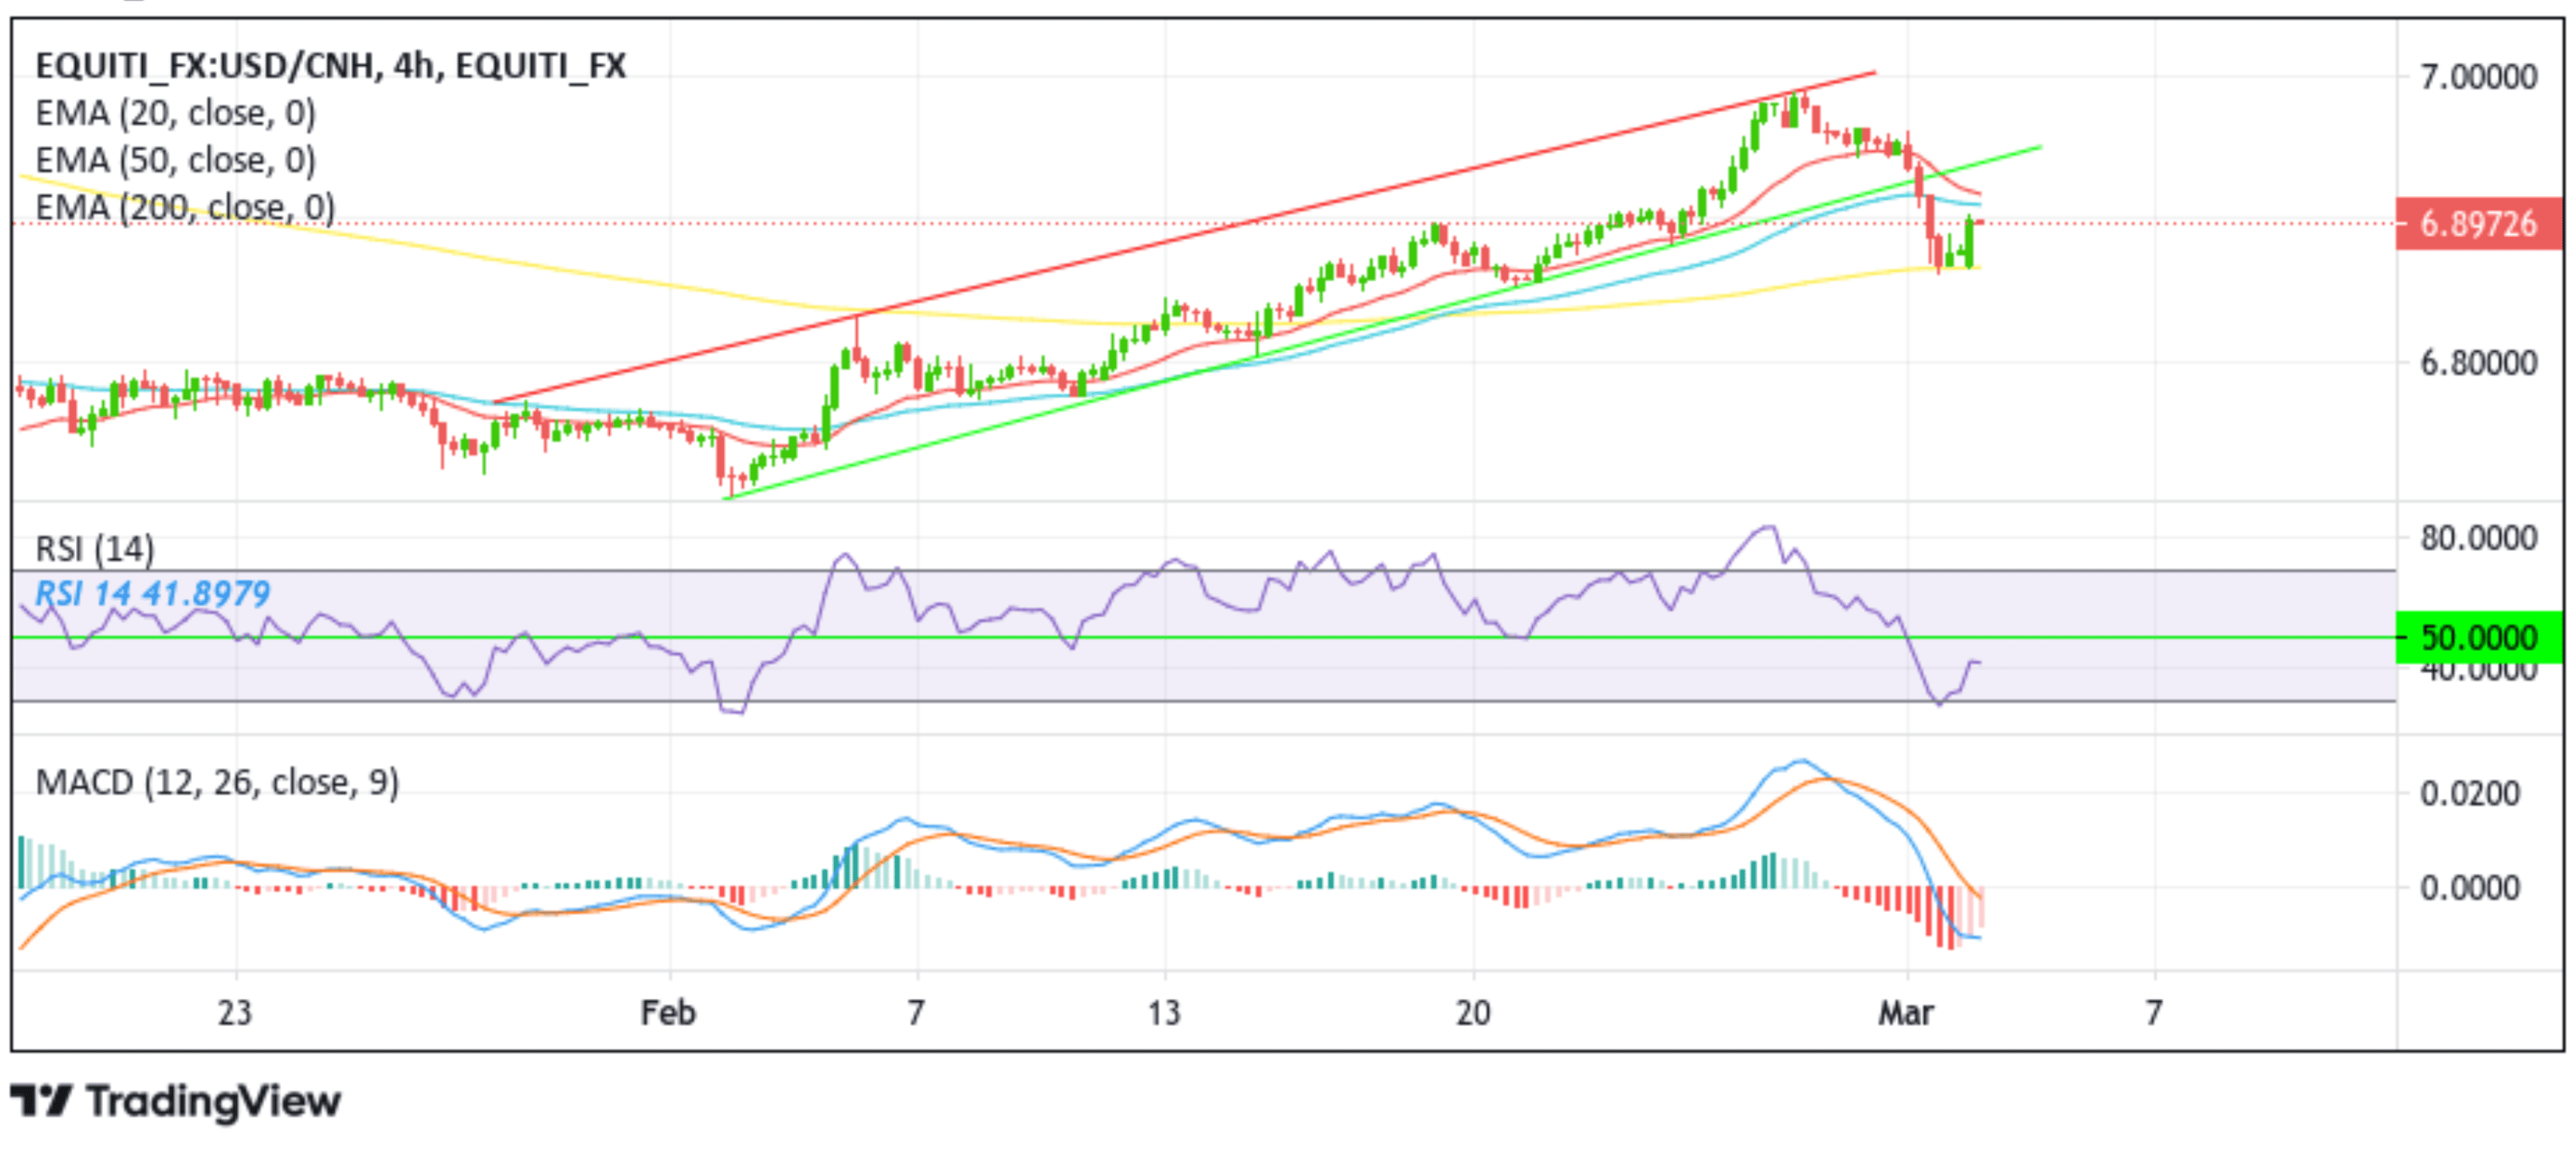
Technical Outlook: Four-Hours USD/CNH Price Chart

From a technical standstill, using a four-hour price chart, the price extended the modest recovery from the 6.86348 – 6.86823 region following a strong sell-off that saw the price break below the critical support level on Wednesday. Some follow-through buying would lift spot prices toward the immediate hurdle plotted by the 20 (red) and 50 (blue) Exponential Moving Averages (EMA) at 6.91793 and 6.90930 levels, respectively. The aforementioned EMA levels would act as resistance for the USD/CNH pair against any additional uptick. However, if the bulls attack the barricades and convincingly break above them, it would pave the way for additional gains around the USD/CNH pair. The subsequent rise afterwards will face some resistance at the key resistance level plotted by an upward ascending trendline extending from the early February 2023 swing low. If the price Pierces this barrier (bullish price breakout), it would pave the way for aggressive technical buying around the USD/CHN pair.
All the technical oscillators are holding in bearish territory. Therefore, it would be prudent to wait for a break above the 20 and 50 EMA levels, followed by a move above the key resistance level, before pricing further upside moves. The Bullish Outlook is supported by acceptance of price above the 200 (yellow) Exponential Moving Average (EMA) at the 6.86455 level; however, the aforementioned conditions need to be met to validate bullish Bias.
On the flip side, any meaningful pullback now finds some support at the 200 (yellow) Exponential Moving Average (EMA) at the 6.86455 level. If sellers breach this floor convincingly, it would negate any near-term bullish outlook and pave the way for aggressive technical selling. The downward trajectory could then accelerate toward the 6.83604 support level.


