NZD/USD Extends US-PCE Inspired Losses Further Below The 0.62000 Mark, US Durable Goods Order Data Awaited


- NZD/USD pair attracted some selling during the second part of the Asian session and reversed an intraday lift from the vicinity of the 0.61743 level
- Modest U.S. Dollar rebound exerts downward pressure on the NZD/USD pair
- U.S. Core PCE Prices accelerated in January, beating market expectations
- Markets now await the release of the U.S. Durable Goods Order data for fresh directional impetus

The NZD/USD cross reversed an intraday lift from the vicinity of the 0.61743 level and attracted fresh selling on Monday during the mid-Asian session. The shared currency looks to extend its steady descent further below the 0.61510/ monthly low amid a robust U.S. Dollar demand.
The U.S. Dollar index (DXY), which measures the value of USD against a basket of currencies, appreciated towards $105.247 in the second part of the Asian trading session rebounding from $105.105 level after earlier hitting a seven-week peak on Friday, as another round of data showing still-high inflation reinforced expectations that interest rates could stay higher for longer.
The personal consumption expenditure price index in the United States increased by 5.4% year-on-year in January of 2023, accelerating from an upwardly revised 5.3% rise in the previous month, the U.S. Bureau of Economic Analysis reported on Friday. Compared to the last month, the PCE Price Index rose by 0.6%, the most in seven months.

Excluding food and energy, The U.S. core PCE price index rose by 4.7% annually, higher than 4.6% in December, and surpassed market expectations of 4.3%, backing signals from Fed policymakers that interest rates must be higher for longer to tame unsustainable price growth.
In other news, Consumer sentiment numbers also came in stronger than expected. The University of Michigan's consumer sentiment index peaked at 67 for February, slightly outpacing a Dow Jones forecast of 66.4. Additionally, sales of new U.S. single-family homes increased by 7.2% in January, the highest level since March 2022. December's sales pace was revised to 625,000 units from the previously reported 616,000.
Commenting on the reports, "Strong U.S. data have completely turned the market in February. The good news has been bad, with rates and equities selling off and the U.S. dollar up. The U.S. economy seems to be re-accelerating, forcing the Fed to hike more in a market hoping for an early Fed pivot," said Athanasios Vamvakidis, global head of G10 FX strategy at Bank of America in London.
That said, the US PCE inflation data came a day before a U.S. Jobless claims data report fell below market expectations, further proving that the U.S. labor market continues to remain tight. Additionally, the jobs data came days before minutes from the Federal Reserve's last meeting showed that policymakers largely agreed to keep raising interest rates to bring inflation back down within target. Furthermore, a slew of data from the world's largest economy in recent weeks pointed to a still-tight labor market, sticky inflation, robust retail sales growth, and higher monthly producer prices raising market expectations that the U.S. Central bank will stick to aggressive interest rate hikes to tame inflation in the U.S. This combined with the hawkish comments by top Fed Officials in the previous weeks triggered the U.S. treasury bond yields to rise higher in turn offering support to the safe-haven greenback.

That said, CME's group Fedwatch Tool is now pricing in the likelihood of a 72.3% chance of a 25 bps rate hike and a 27.7% chance of a 50 bps in the next Fed's monetary policy meeting, lifting the overall Fed target range to 4.75% and 5.00%, respectively.
Shifting to the Kiwi docket, Retail sales in New Zealand declined 0.6% on quarter in the last three months of 2022, reversing from an upwardly revised 0.6% increase in the previous period, according to a report released on Monday by the New Zealand Statistics Office. Compared to Q4 2021, retail sales decreased by 4%, led by falls in the hardware, building, and garden supplies industry (-15%) and in the motor vehicles and parts industry (-10%), after a peak in sales seen during December 2021. This was seen as a factor that undermined the Kiwi and drove flows towards the greenback.
As we advance, investors now look forward to the U.S. docket featuring the release of the U.S. Durable Goods Order data for last month, seen lower at -4.0% from 5.6% in December. Excluding transportation items, the U.S. Core Durable Goods Order data is higher at 0.1% from -0.2% in December. In the meantime, the U.S. bond yields and the broader market risk sentiment will continue to influence the U.S. dollar and allow traders to grab some trading opportunities around the NZD/USD pair.
Technical Outlook: Four-Hours NZD/USD Price Chart
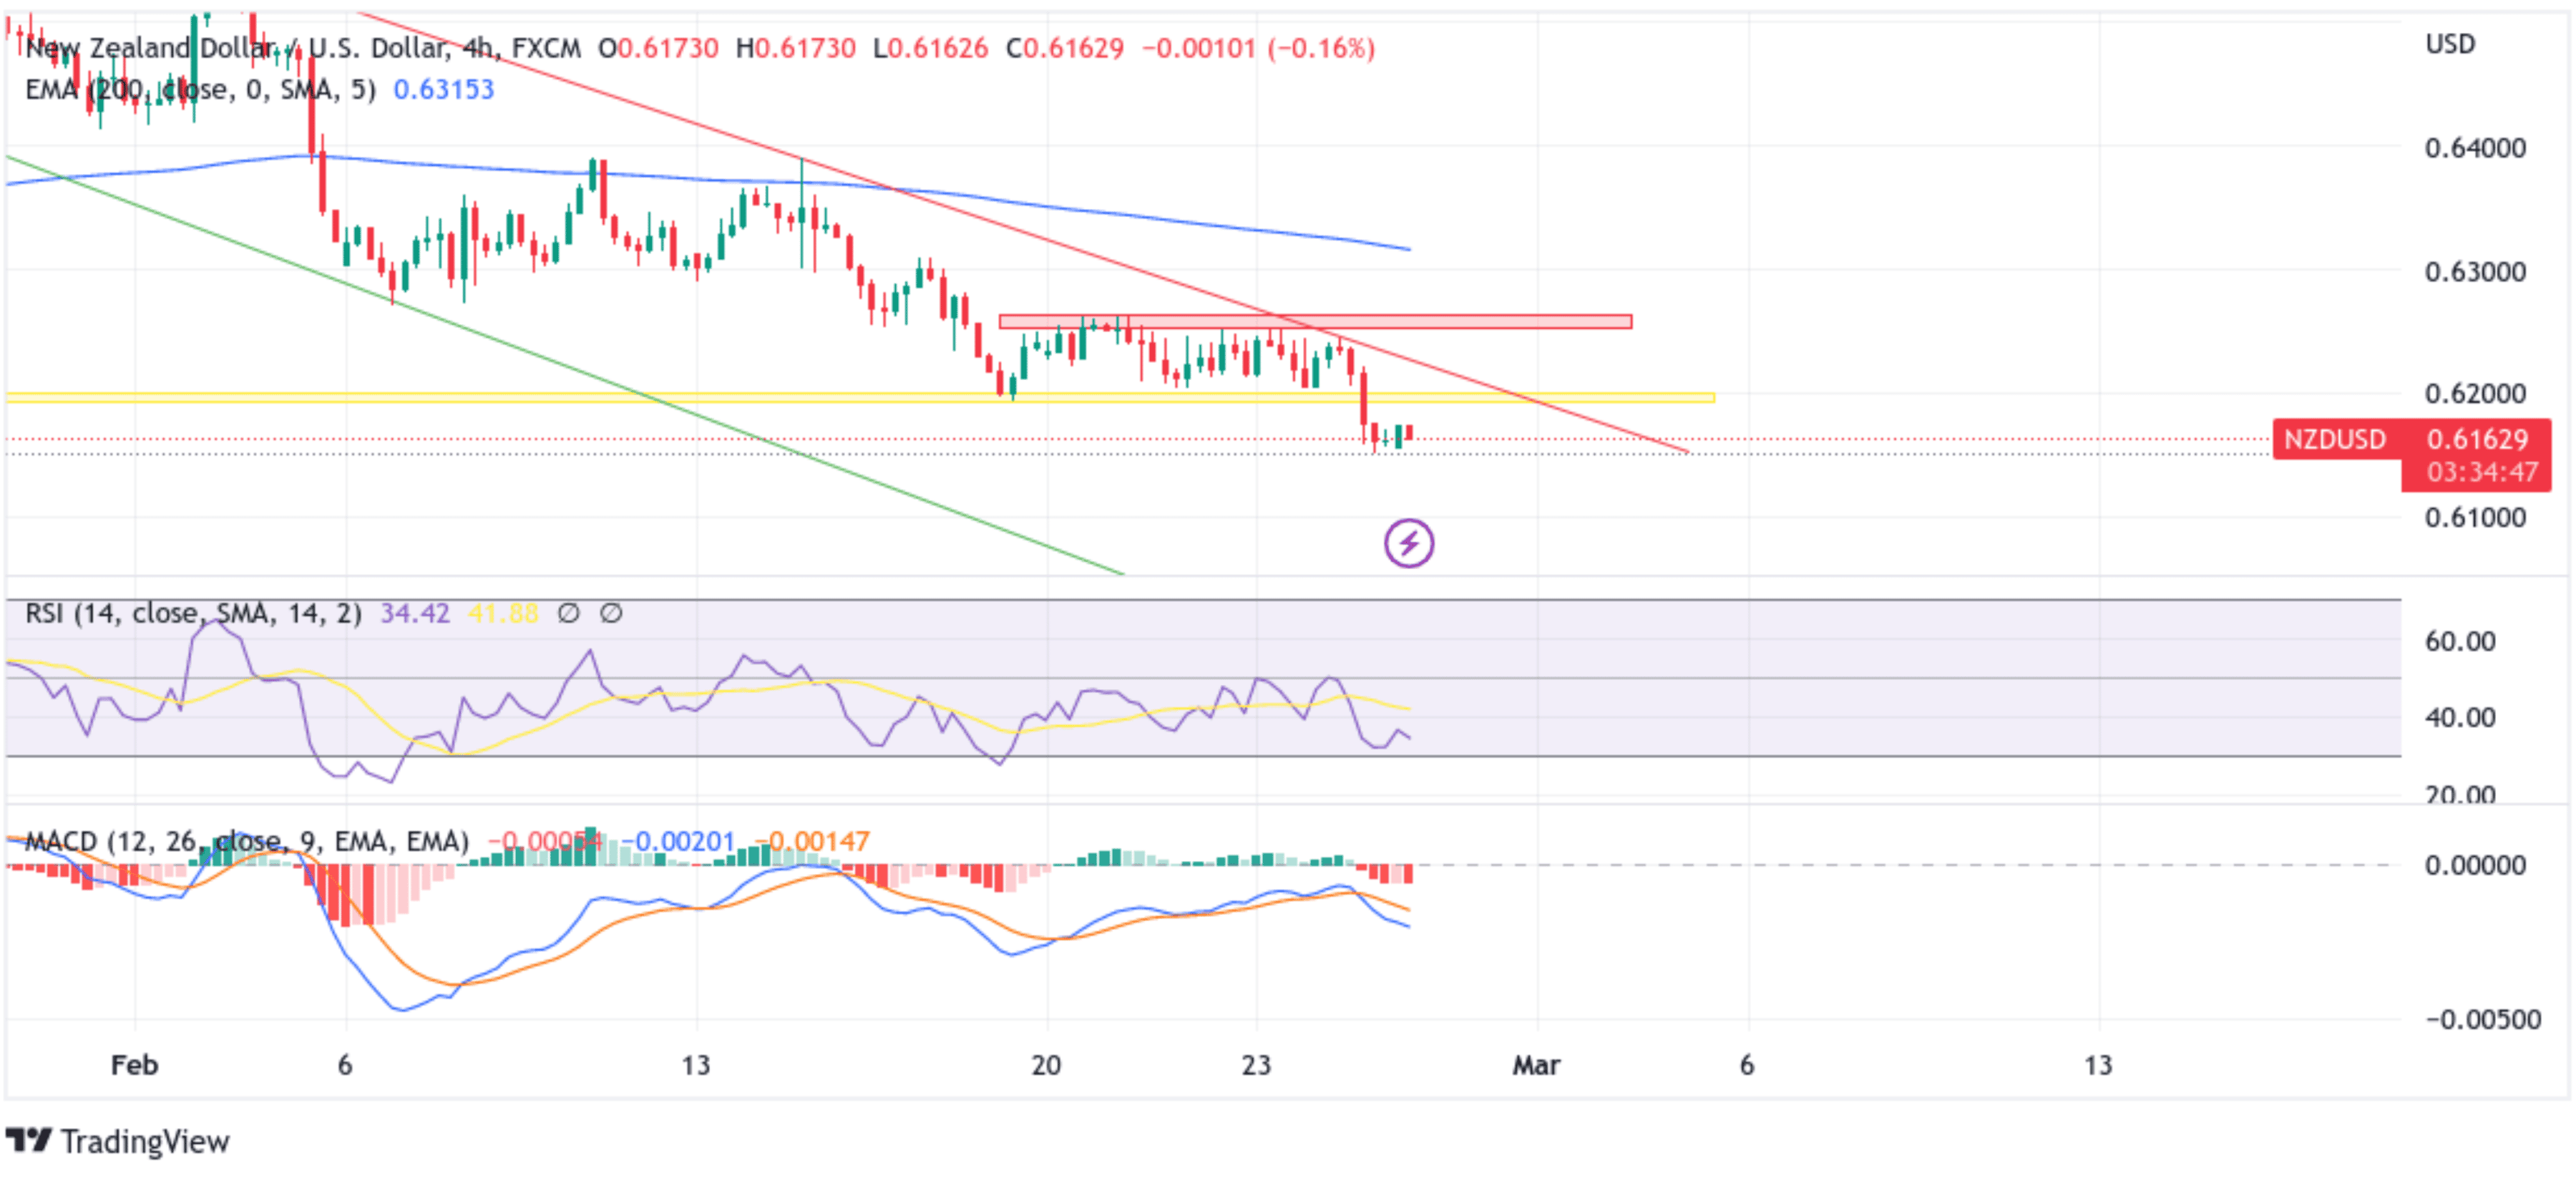
The price has retraced from the vicinity of the 0.61743 level after initially rebounding from the 0.61562 level to reverse the downward trajectory that saw it convincingly break below the key demand zone ranging from 0.61908 - 0.61994 levels. That said, some follow-through selling would drag spot prices toward the key demand zone ranging from 0.61239 - 0.61315 levels, below which sustained weakness would expose the NZD/USD pair to more losses. The downward trajectory could then accelerate toward the 0.61000 psychological mark. If sellers manage to breach this essential floor, downside pressure could accelerate, paving the way for a drop toward the 0.60655 key support level.
The technical Oscillators on the four-hour chart are holding deep in the bearish territory. They are still far from being in the oversold zone, portraying a bearish bias and suggesting a continuation of the downward trajectory. The bearish bias is further supported by the price's acceptance below the 200-day Exponential Moving Average (EMA) at the 0.63157 level.
Conversely, if dip-buyers and tactical traders jump back in and trigger a bullish reversal, initial resistance appears at the zone ranging from 0.61908 - 0.61994 levels. If the price pierces this barrier, buying interest could gain momentum, creating the right conditions for an advance toward retesting the key resistance level plotted by a downward-sloping trendline extending from the early February 2023 swing high. On further strength, the focus shifts toward the key supply zone ranging from 0.62511 - 0.62631 levels.