NZD/USD Rises To A One-Month High Above 0.60100 Level On Softer U.S. Inflation Figures And Mixed Chinese Macro data


Key Takeaways:
- NZD/USD pair extended U.S. CPI-inspired gains on Wednesday and rose to a fresh one-month high
- Markets seem convinced the Fed is done with its rate-hiking cycle after better-than-expected U.S. inflation figures
- Mixed Chinese macro data extends some support for the perceived riskier Kiwi
- The market's focus shifts toward the release of the Producer Price Inflation (PPI), Retail Sales, and the New York Empire State Manufacturing Index data reports for fresh directional impetus

The NZD/USD cross extended its corrective pullback from the vicinity of the 0.58539 level touched on Tuesday during the early North American session. It climbed to a fresh one-month high above the 0.60100 level on Wednesday during the mid-Asian session.
The U.S. Dollar index, which measures the greenback against a basket of currencies, extended its retracement slide from the vicinity of the 105.999 level touched on Friday and dropped to a fresh seven-week low below the 104.600 mark, weighed by the ongoing decline in U.S. Treasury bond yields amid receding market bets for another Fed rate hike. Apart from this, the generally stronger tone around the equity markets undermines the safe-haven buck and drives flows towards the perceived riskier Kiwi.
The markets now seem convinced the Fed is done with its rate-hiking cycle after a U.S. Bureau of Labor Statistics report on Tuesday showed consumer prices in the U.S. were unchanged in October after rising 0.4% in September, compared with a 0.1% increase in market expectations. On a year-to-year basis, the inflation rate in the U.S. dropped to 3.2% in October from 3.7% in September, against a market consensus of a 3.3% increase. Excluding food and energy, the annual consumer price inflation rate in the United States edged to an over-two-year low of 4% in October 2023, from 4.1% in the prior month, while markets expected it to remain steady at 4.1%. Every month, core consumer prices rose only by 0.2%, after a 0.3% increase in September and just below market forecasts of a 0.3% rise.
That said, the mixed Chinese macro data released earlier today further contributed to the sentiment around the NZD/USD cross. A National Bureau of Statistics of China report showed China's industrial production expanded by 4.6% year-on-year in October 2023, after a 4.5% gain in the previous month, beating market forecasts of 4.4%. Additionally, China's retail sales rose by 7.6% year-on-year in October 2023, accelerating from a 5.5% gain in the prior month and exceeding market estimates of 7.0%. These, to a greater extent, overshadow the disappointing Fixed Asset Investment figures, which increased by 2.9% year-on-year to CNY 41.94 trillion in the first ten months of 2023, compared with market forecasts and figures in the prior period of 3.1% growth.
As we advance, investors look forward to the U.S. docket featuring the release of the Producer Price Index (PPI), Retail Sales, and the New York Empire State Manufacturing Index data reports. These, plus the broader market risk sentiment, will influence the U.S. dollar price dynamics and provide directional impetus for the shared currency.
Technical Outlook: Four-Hours NZD/USD Price Chart
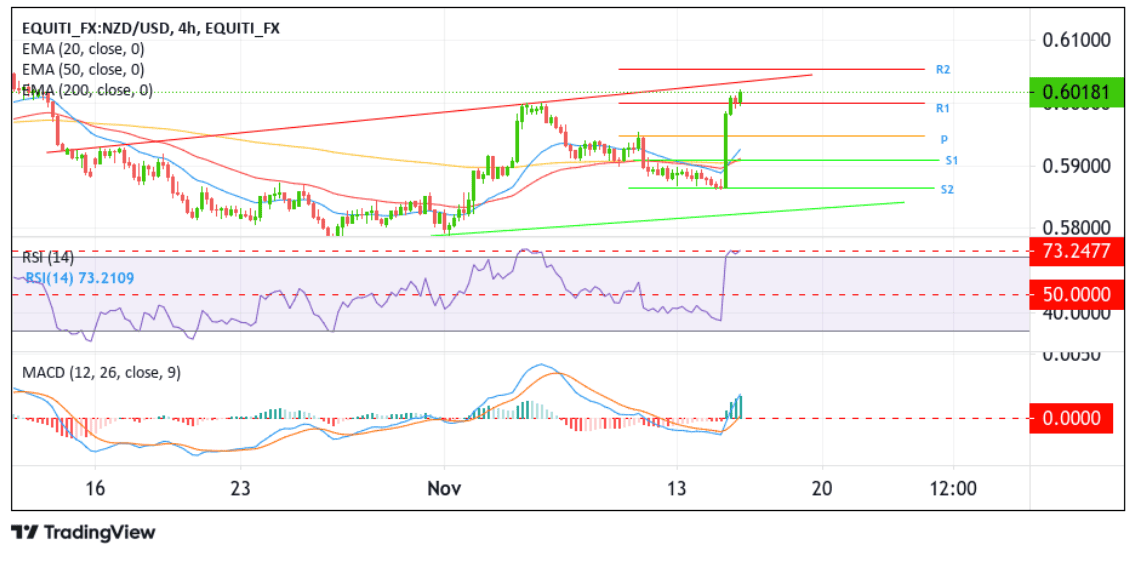
From a technical standstill, NZD/USD is trading near a key resistance level plotted by an ascending trendline extending from the late-August 2023 swing high after extending the modest pullback from the vicinity of the 0.58616 level touched on Tuesday. Some follow-through buying would uplift spot prices toward the aforementioned resistance level, about which, if buyers convincingly break above this barrier, buying interest could gain further momentum, paving the way for a move toward attacking the 0.60553 resistance (R2) level. A clean move above this level will reaffirm the bullish thesis and pave the way for further gains around the NZD/USD cross.
All the technical oscillators on the chart are holding in positive territory, suggesting continuing the bullish price action this week. However, the Relative Strength Indicator (RSI-(14)) is flashing overbought conditions, cautioning traders against submitting aggressive bullish bets and waiting for near-term corrective moves before placing bullish bets in favour of the bullish trend. Nevertheless, the bullish outlook is supported by the acceptance of the price above the technically strong 200-day (yellow) Exponential Moving Average (EMA) at the 0.59048 level.
On the flip side, if dip-sellers and tactical traders jump back in and trigger a bearish reversal, initial support comes in at the 0.60000 round mark. If sellers manage to breach this floor, downside pressure could accelerate, paving the way for a drop toward the 0.59471 key pivot level (P). A clean move below this level could see the shared currency extend its corrective slide toward tagging the 20 (blue) and 50 (red) day EMA levels at 0.59375 and 0.59156 levels, respectively, before dropping toward the 0.59096 support level (S1), which sits above the technically strong 200-day (yellow) EMA level at 0.59085. A convincing move below these barriers would negate the bullish outlook and act as a new trigger for side-lined sellers to join, hence rejuvenating the bearish momentum and provoking an extended decline toward the 0.58616 support level (S2) and, in extreme bearish cases, the NZD/USD cross could extend a leg down toward retesting the key support level plotted by an ascending trendline extending from the late-October 2023 swing low.