US30 Price Extends Modest Rebound Above 33000.00s On Signs Of Fed Pivot 50 EMA Hurdle Lies Ahead


- The US30 Futures index witnessed some dip buying on Friday and lifted spot prices to almost a one-week high
- A mixed commentary by top fed officials offers some support to the US30 futures index
- A Better than expected earnings and revenues data from major companies within the Dow Jones index offer an intraday boost to the US30 futures index

The US30 futures index prolonged its recent strong move-up witnessed over the past two days and gained traction for the third successive day on Friday. The momentum lifted spot prices to almost a one-week high around the 33063 - 33084 levels during the first half of the Asian session.
A mixed commentary by top Fed officials overnight on Thursday triggered the treasury bond yields to retreat from their record highs and move lower, which in turn was seen as a factor that undermined the US30 futures index and caused it to inch downwards. The modest rebound in the US30 Futures index reversed solid gains it had acquired earlier in the session after Atlanta Federal Reserve President Raphael Bostic said that he thinks the central bank can keep its interest rate hikes to 25 basis points rather than the half-point increase favored by some other officials. However, Fed Governor Christopher J. Waller struck a tougher tone in his comments to the Mid-Size Bank Coalition of America, raising the possibility of a higher terminal rate if inflation numbers don’t cool.

“The recent data indicate that we haven't made as much progress as we thought. That assessment goes for both overall inflation, and "Core" inflation, which strips out volatile energy and food prices and is a good guide to future price increases”. “The recent data also suggest that consumer spending isn't slowing that much, that the labor market continues to run unsustainably hot, and that inflation is not coming down as fast as I had thought,” he said. “If those data reports continue to come in too hot (referring to this month’s inflation and jobs data), the policy target range will have to be raised this year, even more, to ensure that we do not lose the momentum that was in place before the data for January were released,” Waller said.
On the economic data front, a US Department of Labor report on Thursday showed the number of Americans filing for unemployment benefits fell by 2,000 from the previous week to 190,000 on the week ending February 25th, below market expectations of 195,000. The latest value remained close to the nine-month low of 183,000 hit at the end of January, giving further evidence that the US labor market remains tight in part to reduced labor force participation. That said the downbeat data was seen as a factor that undermined the greenback but in turn further cemented market expectations that the FED will stick to high-interest rates in order to tame inflation in the US.

On the earnings front a Better than expected earnings and revenues data from major companies within the Dow Jones index was seen as another factor that offered support to the US30 futures index. Dell Technologies (NYSE: DELL) gained nearly 3% after its fourth-quarter earnings and revenue topped Wall Street’s estimates. The tech company’s adjusted earnings were $1.80 per share, higher than the consensus estimate of $1.63 from analysts polled by Refinitiv. Dell’s revenue also exceeded expectations, coming in at $25.04 billion versus analysts’ estimates of $23.39 billion.
Additionally, Hewlett Packard Enterprise Co. (NYSE: HPE) added 1.9% after reporting Q1 EPS of $0.63 versus $0.54 expected on revenues of $7.8 billion versus $7.44 billion expected. The company also forecasted Q2 2023 EPS $0.44 - $0.52 versus $0.47 expected, while revenues are forecasted to total $7.1 - 7.5 billion versus $7.04 billion expected. Elsewhere, Salesforce Inc (NYSE: CRM) shares rose 12% on thursday after the business software maker beat fourth-quarter expectations for adjusted profit per share and forecast fiscal 2024 results well in excess of expectations.
As we advance, the best-performing sectors in the US30 index on Friday were the technological, industrial, and consumer sectors, while the worst-performing were the Healthcare and Financial sectors. That said, Salesforce Inc (NYSE: CRM) led the list of top gainers after it gained 11.50%/19.24 points to trade at $186.59 per share. Boeing (NYSE: BE) followed second after it jumped 2.69%/5.51 points to trade at $210.06 per share. The Coca-Cola Company (NYSE: KO) came in third after it added 1.46%/0.86 points to trade at $59.72 per share.

On the other hand, JP Morgan Chase & Co.led the list of top losers after it shed 1.04%/1.48 points to trade at $141.07 per share. Amgen Inc. (NASDAQ: AMGN) followed second after it lost 0.61%/1.45 points to trade at $234.74 per share.
Technical Outlook: Four-Hour US30 Futures Index Price Chart
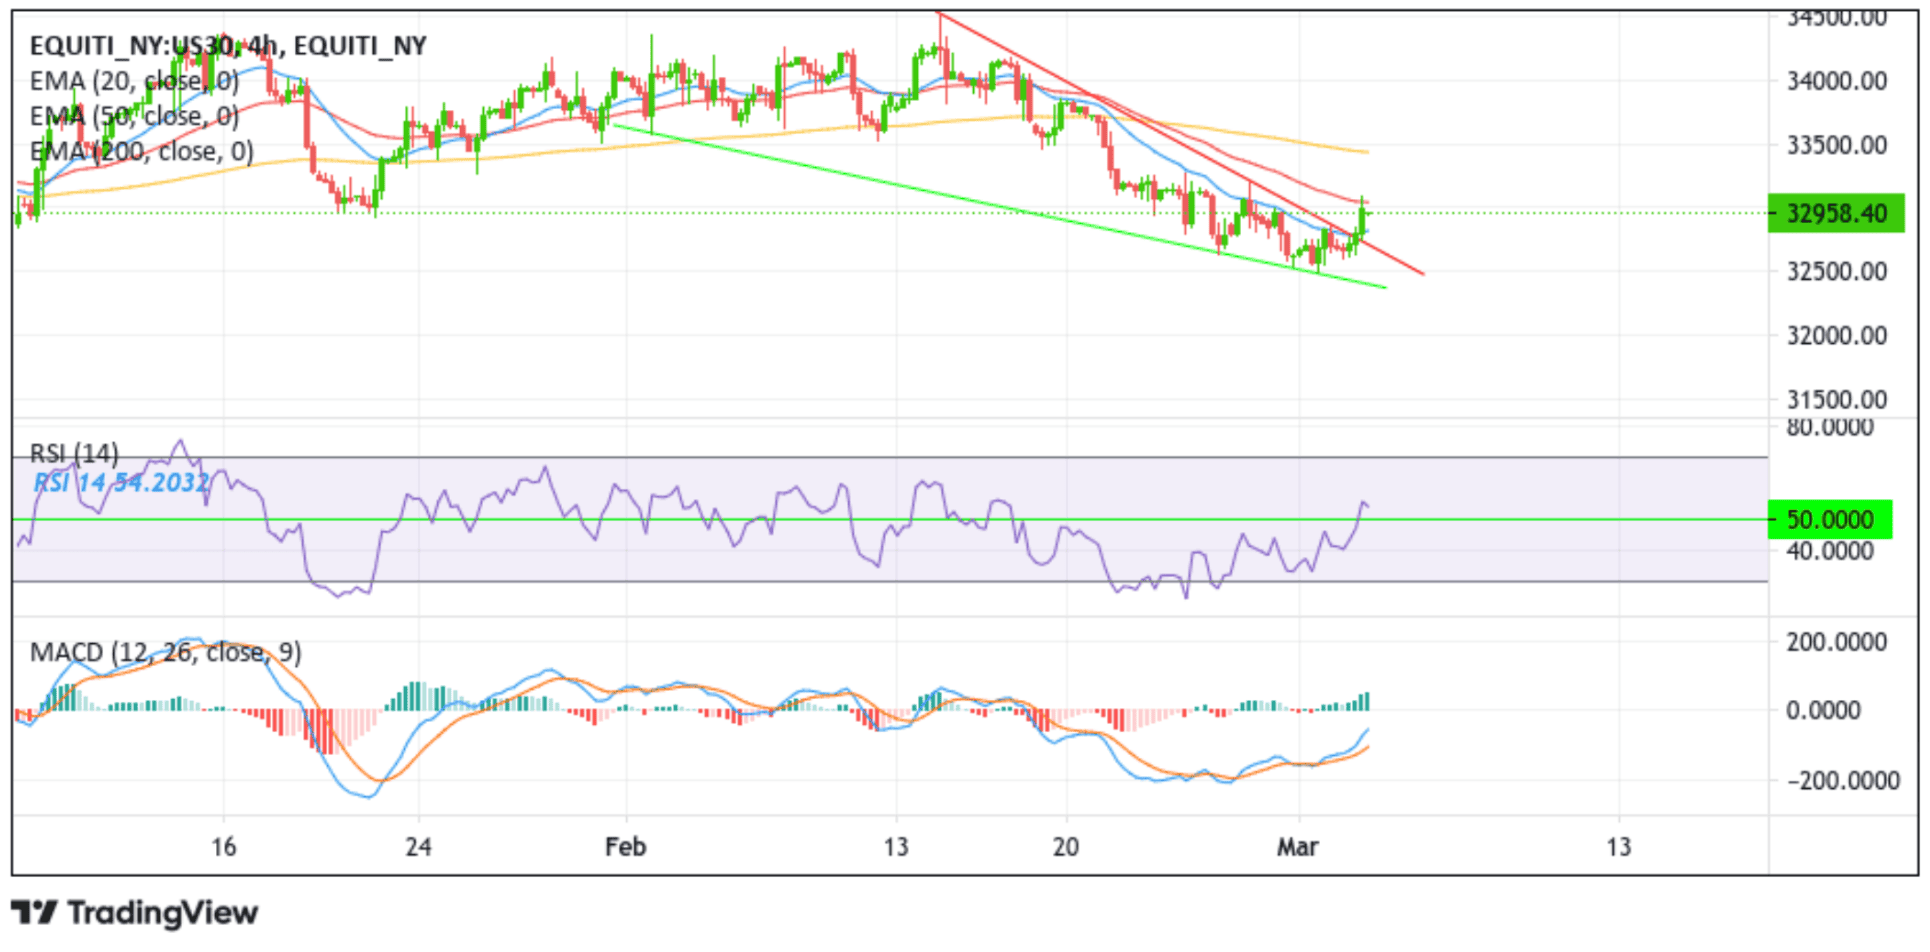
From a technical standstill using a four-hour price chart, the price has extended Wednesday's modest rebound from the vicinity of 32491.69 level after a firm rejection from the lower horizontal trendline of the descending channel pattern turned support level. The move beyond Tuesday’s high around the 32753.11 level, confirmed a bullish breakout and supported prospects for additional gains. Some follow-through buying would re-encounter initial resistance at the 50 (red) Exponential Moving Average (EMA) level at $33041.87. If Bulls pierce this barrier, the bullish momentum could accelerate but would face another major hurdle plotted by the 200 (yellow) Exponential Moving Average (EMA) level at $33484.85. A convincing break above this level would negate the bearish bias and pave the way for aggressive technical buying.
The MACD oscillator on the four-hour chart is still holding in the negative territory, pointing to a sign bearish price action the current uptick risks chances of fizzling out. The bearish bias is further supported by the acceptance of the price below the 200 Exponential Moving Average (EMA) at the $33484.85 level. Additionally the 20 and 50 Exponential Moving Average (EMA) crossover (Golden cross) at $33743.53 validates the bearish credence.
That said, if dip-sellers and technical traders jump in and spark a bearish turnaround, the price will first find support at the $32822.48 support level. If sellers manage to breach this barricade, downside pressure could accelerate, paving the way for a drop toward retesting the key support level plotted by a downward-sloping trendline extending from the mid-February 2023 swing high. On further weakness, the focus shifts towards the 32556.32 - 32638.70 demand zone.

