Gold Remains Depressed Below $2000.00, And Further Downtick Seems Possible Amid A Sustained U.S. Dollar Demand


- Gold drops below the $2000.00 mark, pressured by various factors
- The strong U.S. dollar rally combined with a hawkish fed meeting minutes act as a headwind to the commodity
- A U.S. debt default would have severe consequences for the U.S. economy, in turn, would undermine the greenback and lend some support to the precious yellow metal

Gold declined on Thursday, remaining under bearish pressure, and dropped to a daily low below 1957.00 amid the risk-averse. The precious yellow metal trades at $1956.68 an ounce, posting a 0.03% daily loss. Gold stays in negative territory amid a stronger U.S. dollar across the board, as the risk-off market mood underpinned the safe-haven greenback and acted as a headwind for the yellow metal.
Apart from this, Gold continues to be pressured by firm market expectations that the Fed is less likely to halt its aggressive tightening campaign anytime soon, which remains supportive of the greenback. The minutes of the Fed's May meeting showed on Wednesday that the Federal Reserve's policy makers had expressed reluctance to raise interest rates beyond the current level during their May meeting. This hesitation stemmed from mounting pressures on the banking industry and the emergence of economic challenges. However, the Fed did not intend to decrease rates, as inflation levels were still excessively high.
That said, fed fund futures traders have seen pricing in almost a 70% chance of a 25 bps interest rate hike in the next Fed meeting in June, with the remaining 30% favored for a surprising 50 bps interest rate hike, according to the CME's Fedwatch tool. Further weighing down on gold prices were signs of a potential recession in the U.S., sticky inflation, and robust job growth, all of which continue to underpin the greenback, suggesting the path of least resistance is to the downside for Gold prices. Additionally, worries about a potential decline in Chinese demand weighed on gold prices, given the country's struggle with a fresh surge of COVID-19 cases that have raised market concerns about additional disruptions to economic activities. This comes days after a slew of softer Chinese macroeconomic readings earlier this month showed the world's second-largest economy's post-Covid rebound had stalled, adding to worries about a global economic downturn.
Attention remains on the U.S. Debt ceiling talks between negotiators from the White House and the Republican team, in which a deal on how far the U.S. government could raise its debt ceiling has yet to be struck. The U.S. government now runs the risk of defaulting on its debt as the June 1st deadline is fast approaching, which could plunge the world's largest economy into a recession and have further dire consequences for the global economy. Despite the market uncertainty, the greenback saw safe-haven solid demand as investors shied away from riskier assets and flocked to traditional safe-haven assets, which in turn benefited the greenback and weighed further on gold prices. In fact, following the unease over the U.S. debt ceiling talks, the U.S. Dollar Index (DXY), which measures the value of USD against a basket of currencies, surged on Tuesday and hit a fresh two-month high/ 103.9 on safe-haven demand.
As we advance, investors look forward to the release of the U.S. GDP (QoQ)(Q1) data, U.S. Initial Jobless Claims data, and the U.S. Pending Home Sales (MoM) (Apr) data, all due for release later in the north-American session. In the meantime, the U.S. bond yields and broader market risk sentiment will influence the U.S. dollar and allow traders to grab some trading opportunities around the XAU/USD pair.
Technical Outlook: Four-Hours XAU/USD Price Chart
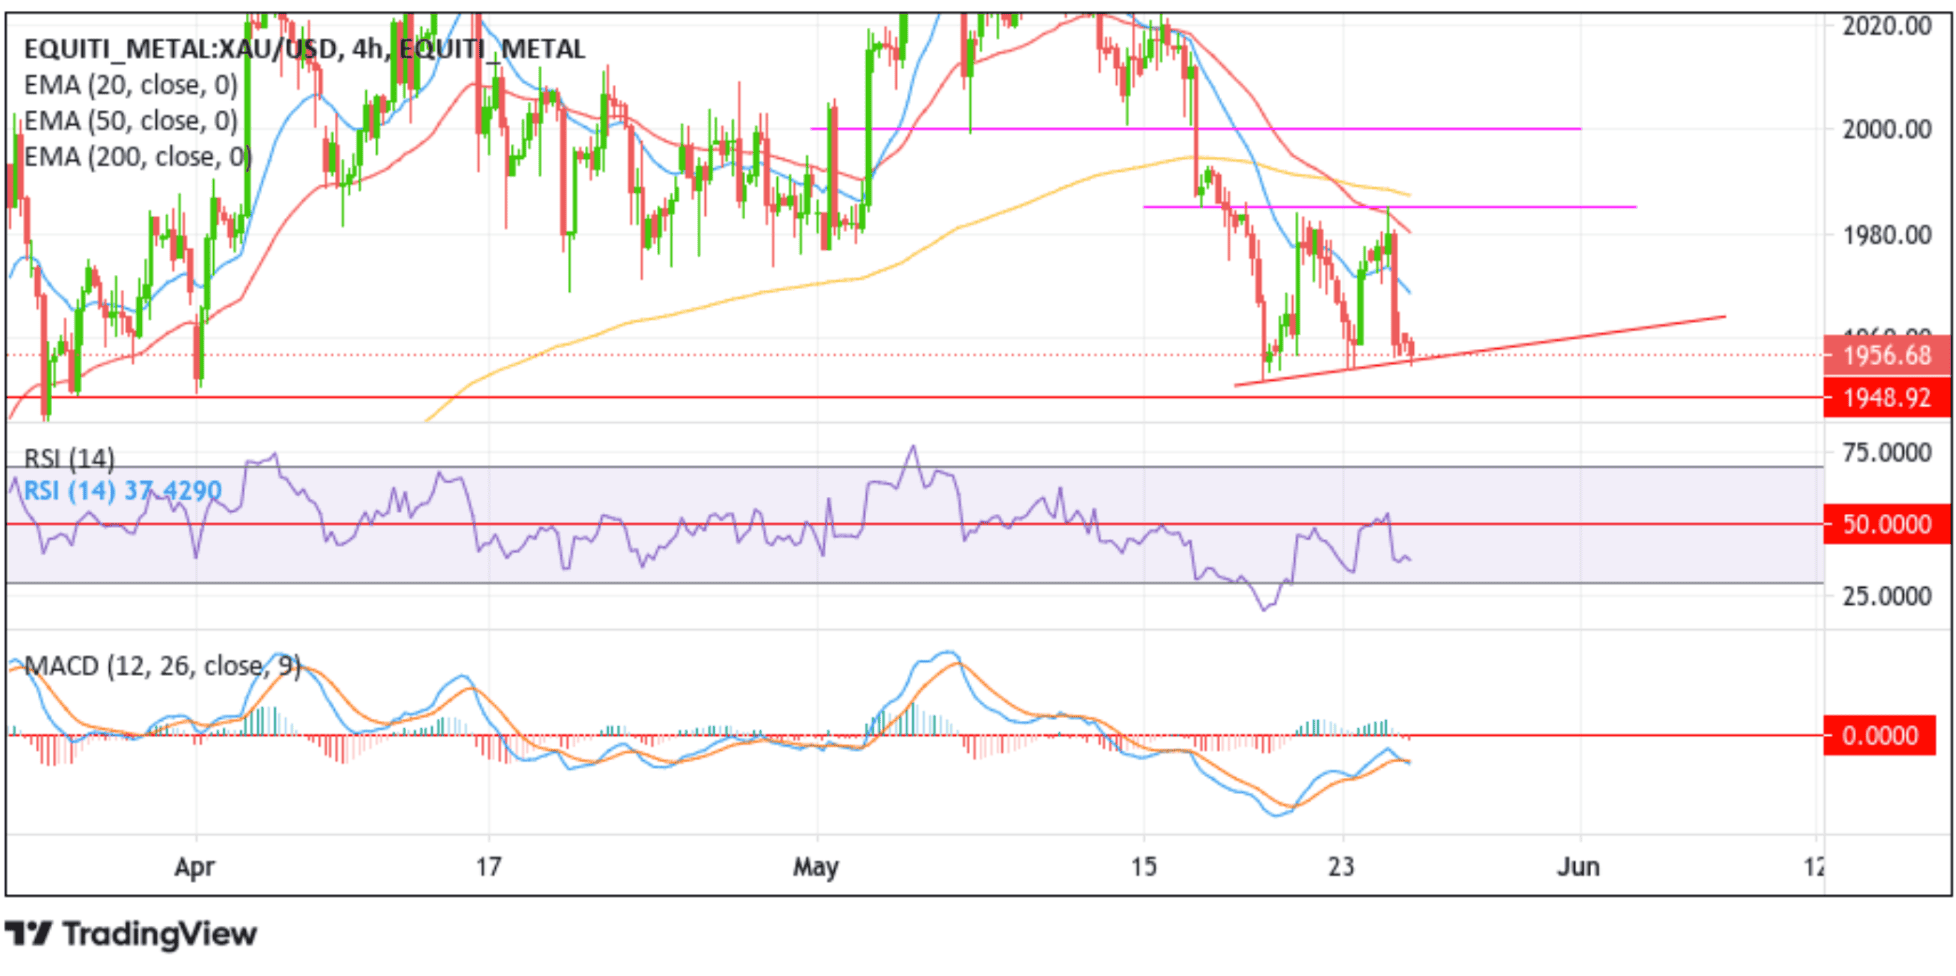
From a technical standpoint, Gold prices rebounded after breaking below the key support trendline earlier in the session. A convincing move below the aforementioned support level later in the session would reaffirm the negative bias and pave the way for additional losses. Gold prices could then accelerate the fall toward the immediate support at the $1948.92 level. A decisive flip of this support level into a resistance level could pave the way for further south side moves around the XAU/USD pair.
All the technical oscillators on the chart are in negative territory, suggesting the continuation of the bearish price action this week. Further supporting the bearish outlook is the acceptance of price below the technically strong 200-day (yellow) Exponential Moving Average (EMA) at the 1995.24 level. Additionally, the 50 (red) and 200 (yellow) days Exponential Moving Averages (EMA) crossover (golden cross) at 1991.18 adds credence to the bearish bias.
If dip-buyers and tactical traders resurface and spark a bullish turnaround, initial resistance comes in at the 20-day (blue) Exponential Moving Average (EMA) at the $1979.86 level. Some follow-through buying should pave the way for a rally toward tagging the 50-day (red) EMA at $1979.86. A subsequent move above this level would pave the way for an ascent toward the $1985.40 resistance level. If buyers breach this ceiling, upside pressure could accelerate toward the 50 (red) and 200 (yellow) days crossover resistance at $1991.18. If sidelined buyers join from this level, it will rejuvenate the bullish momentum, provoking an extended rally above the $2000.00 psychological mark en route to the 2001.05 resistance level.