Gold Rebounds And Moves Back Above 2370.00 Levels as U.S. Dollar Takes A Breather


Key Takeaways:
- Gold moves back above the $2370.00 level after attracting fresh buying
- Gold continues to draw support from tensions in the Middle East despite signs of subsiding
- Firm hawkish Fed expectations continue supporting the greenback and should help cap the upside for gold prices
Gold's price caught fresh bids on Thursday during the Asian session and built on the overnight pullback from the vicinity of the $2354.51 level. Spot prices now sit above $2370.00 levels, up almost 0.4%/9.6 pips for the day, and managed to reverse part of the previous day's losses.
Gold Prices retreated on Wednesday amid an improvement in risk appetite as tensions in the Middle East seem to have subsided after Israeli officials commented that they considered striking Iran on Monday but decided to wait with Prime Minister Benjamin Netanyahu of Israel asserting that Israel would make its own decisions regarding how to defend itself, as Western countries urged restraint in responding to a series of attacks from Iran. Meanwhile, the U.S. announced on Wednesday that it would impose new sanctions on Iran in the coming days, according to Jake Sullivan, the White House National Security Advisor.

Meanwhile, the U.S. dollar index, which measures the greenback against a basket of currencies, lost ground for the second consecutive day on Thursday as retreating treasury bond yields weighed heavily on the buck and turned out to be a key factor that helped cap the downside for the XAU/USD cross.
Despite the combination of supporting factors, the upside for gold seems limited. The U.S. dollar is still supported by elevated U.S. Treasury bond yields bolstered by firm hawkish Fed expectations. This suggests the current price action runs the risk of fizzling out sooner or later, and the path of least resistance for gold is to the upside.
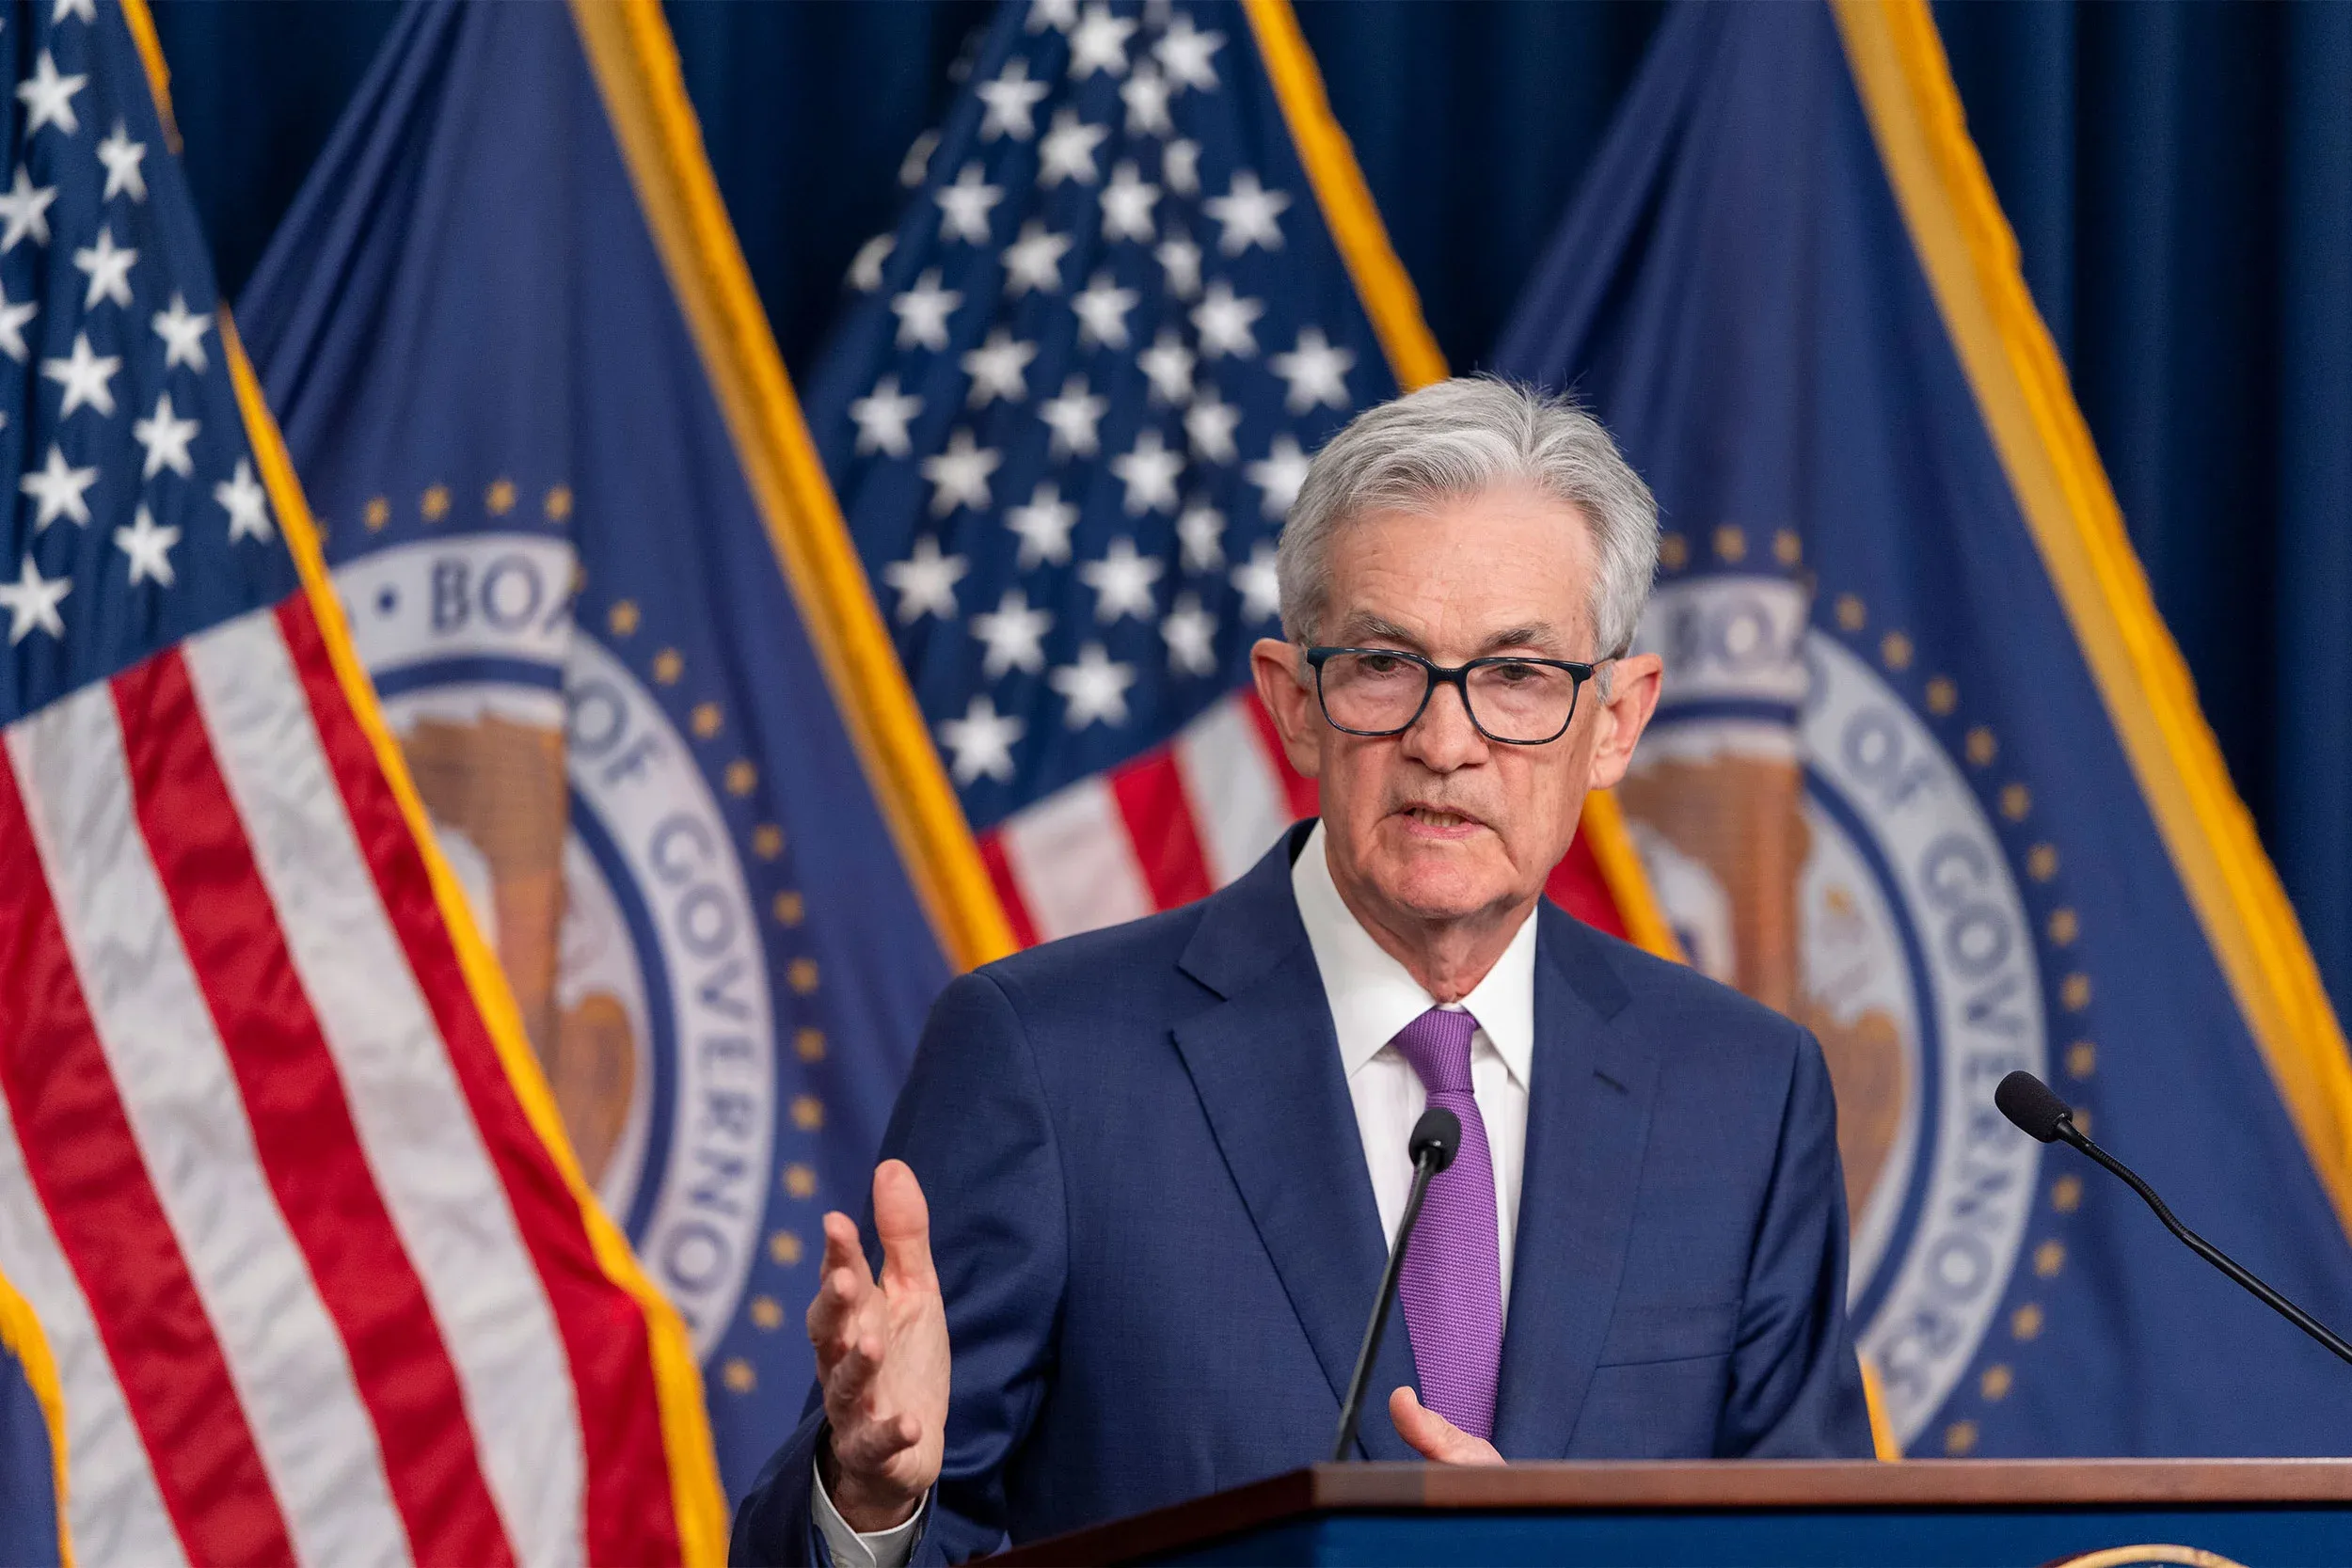
In fact, markets feel convinced that the Fed will delay cutting rates and prolong its hawkish stance through 2024 after Fed Chair Jerome Powell said on Tuesday that interest rates could need to stay higher for longer as the battle to bring back to its 2% target is far from over.
Jerome Powell, while speaking at the Washington Forum on the Canadian Economy, said, "More recent data shows solid growth and continued strength in the labor market, but also a lack of further progress so far this year on returning to our 2% inflation goal,"
Powell's comments matched closely those of Fed Governor Michelle Bowman, who said on Wednesday that progress on slowing U.S. inflation may have stalled. Whether rates are high enough to ensure inflation returns to the Fed's 2% target remains an open question.
The central bank officials' comments come days after a U.S. Census Bureau data report showed consumer spending at the retail level rose more strongly than market consensus in March, suggesting resilience in consumer spending even as inflation remains persistent.
The stronger U.S. retail sales figures join last week's U.S. inflation numbers and earlier this month's hot job numbers in reinforcing market expectations that the Fed may not move to lower interest rates as soon as the June meeting but rather have to wait further before starting cutting rates, probably toward late 2024.
Markets are now anticipating the first rate cut in July or September rather than June, CME's Fed Watch tool shows. The odds of a June rate cut are currently down to 6.5% from 59.1% one week ago.
As we advance, investors look forward to the U.S. docket, which will feature the release of the Philadelphia Fed Manufacturing Index (Apr), Initial Jobless Claims (previous week), and Existing Home Sales (Mar) data reports. Investors will also look for cues from the speeches of several Fed officials.
Technical Outlook: One-Day Gold Price Chart
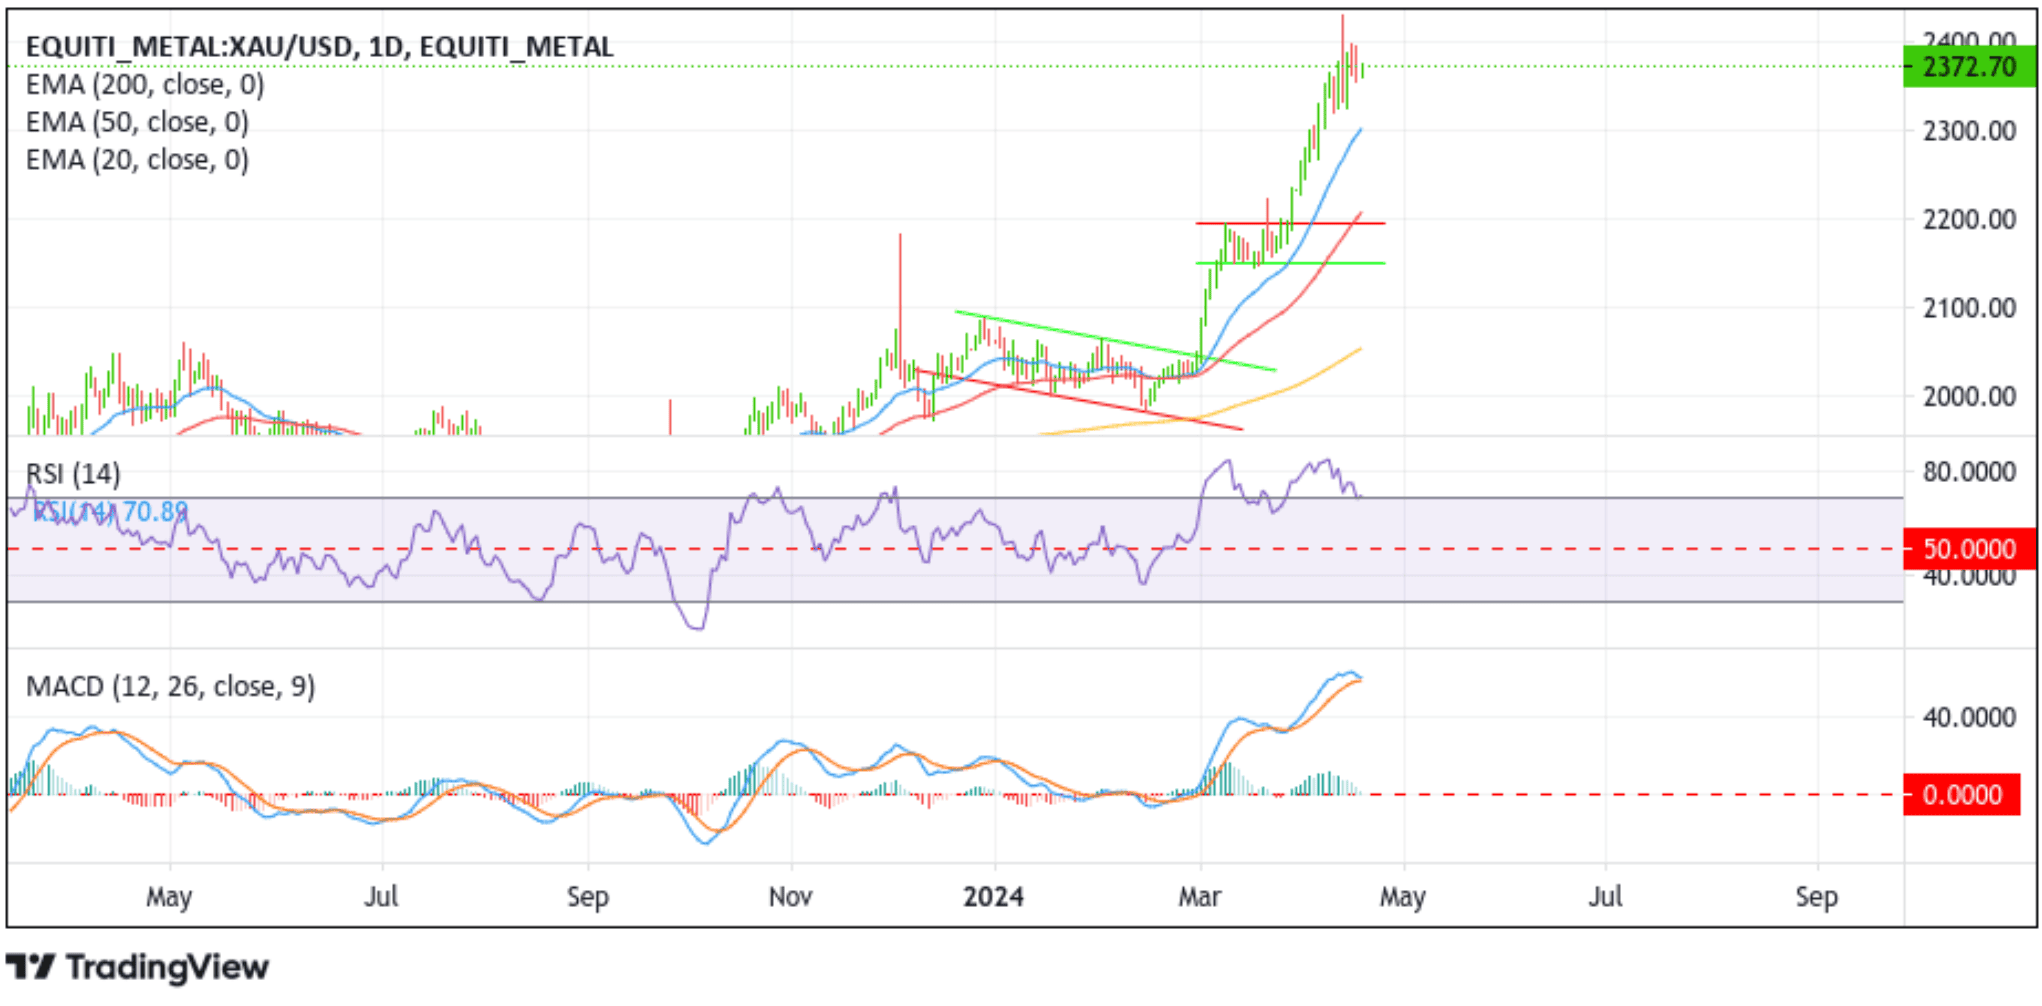
Gold's daily chart shows that the precious yellow metal is heading for a significant correction despite the bullish uptick. The Relative Strength Indicator (RSI) has moved from the 80 to 70 levels (70.89 as of press time), suggesting that selling pressure is building up and that a move below the 70.00 level is highly likely on the cards. Furthermore, the formation of a Doji candlestick on Tuesday, which usually has a strong bearish reversal pattern, suggests that further selling is ahead.
That said, Wednesday's swing low at the $2354.51 level now acts as immediate support ahead of the $2350.00 level. On further weakness, gold drops further toward the demand zone, ranging from $2325.20 - $2318.99 levels.
On the upside, the $2377.65 level is now a barrier against further uptick. Gold could rise toward the $2398.30 - 2395.41 supply zone if the price pierces this level. If this zone fails to hold, gold accelerates toward the all-time high of $2431.39, which has now become a resistance level.