UK FTSE 100 Index Rebounds From Weekly-Low As BOE Ends Run Of 14 Straight Rate Hikes, Moves Back Above Mid-7600.00 Mark


Key Takeaways:
- UK's blue-chip FTSE 100 futures index pares BoE-inspired losses and moves back above the mid-7600.0 mark
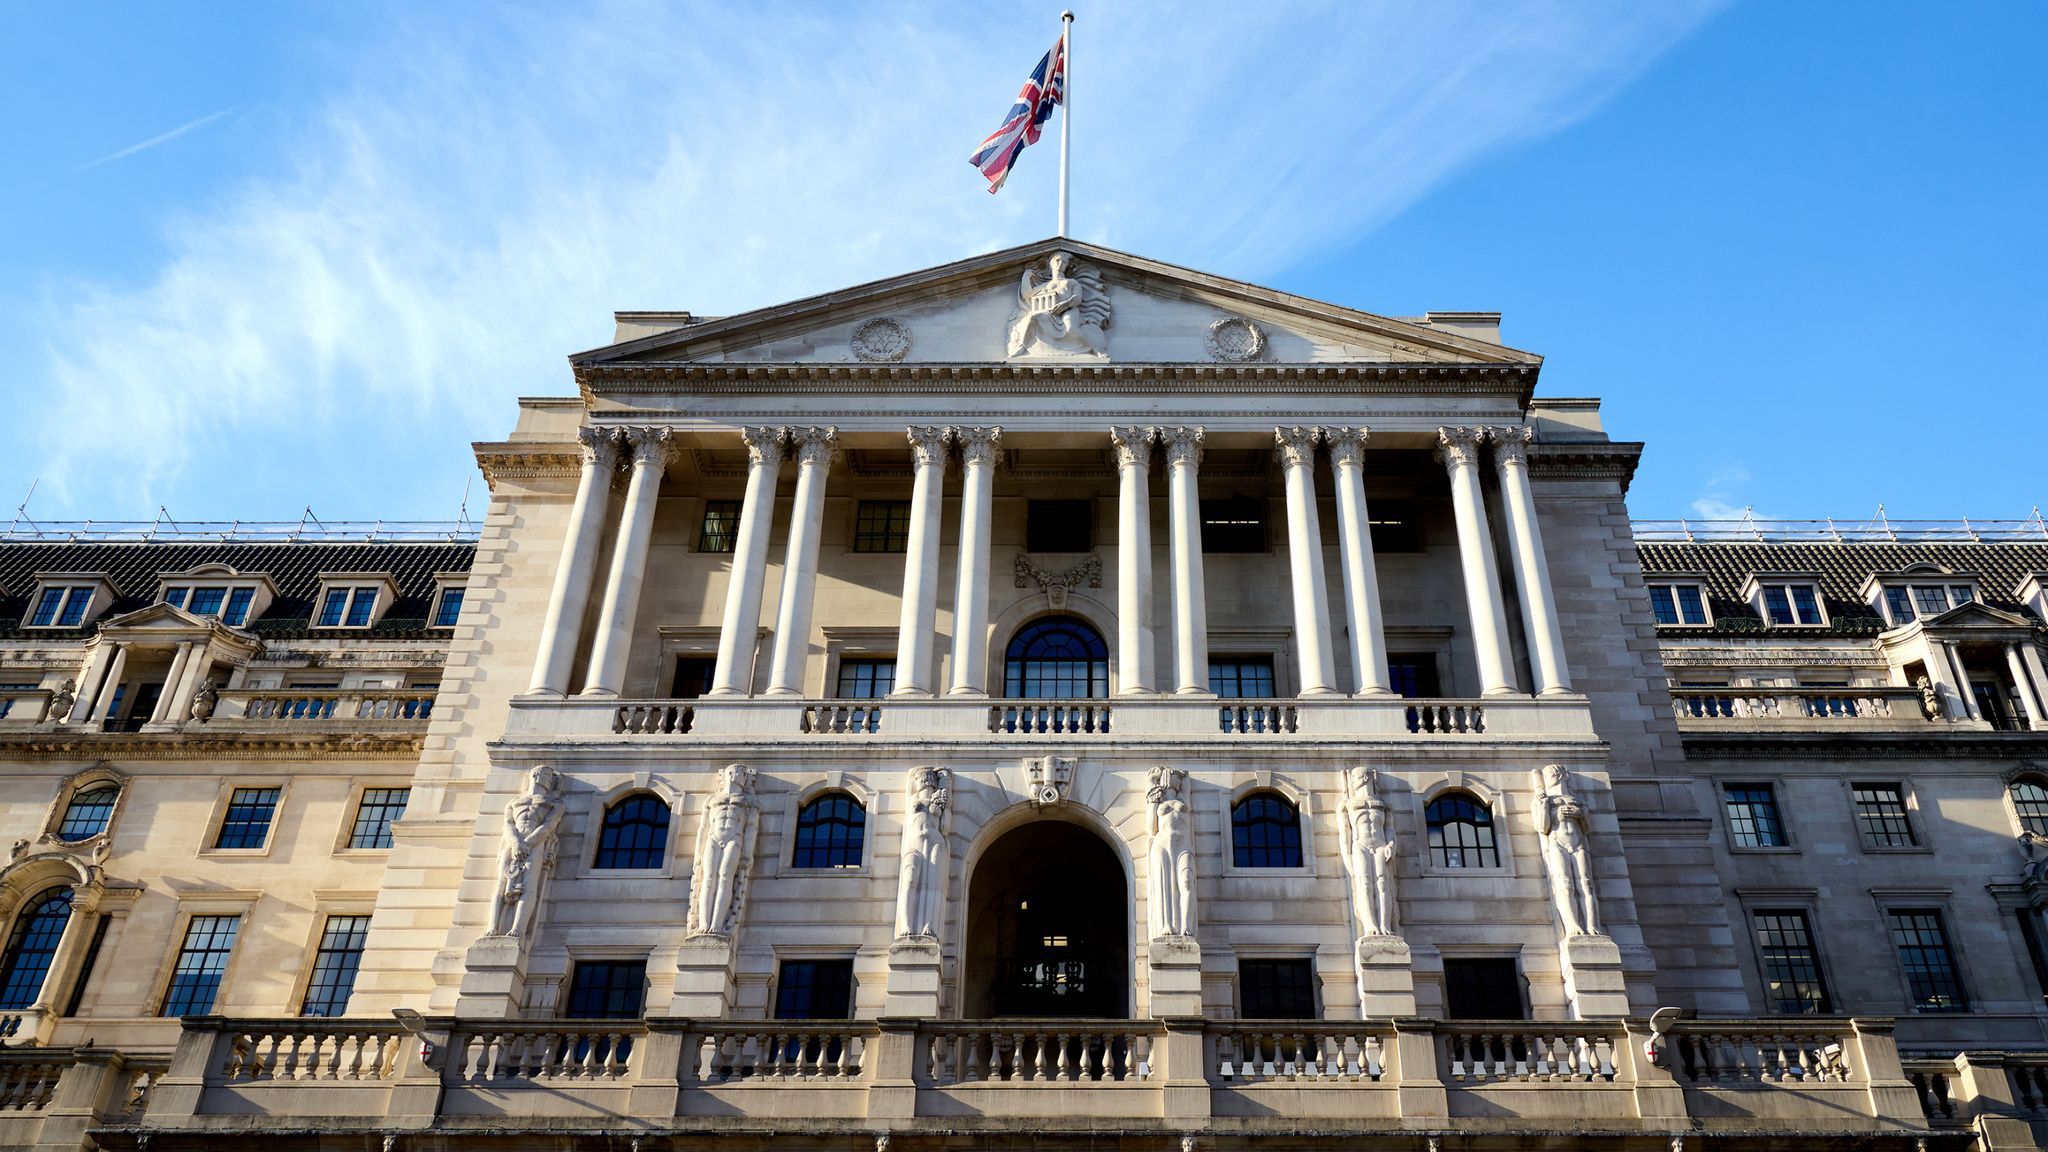
- Bank of England (BoE) held its overnight lending rate at 5.25% during its September meeting amid cooler inflation in the U.K
- J.D. Sports Fashion Plc. (London: J.D.) and Ocado Group, Plc. (London: OCDO) led the list of top gainers and losers on Friday
- Markets await a slew of U.K. macro data for fresh UK FTSE 100 index directional impetus
The U.K.'s blue-chip FTSE 100 futures index edged higher on Friday during the Asian Pacific session, following a modest bounce from the vicinity of the 7633.6 level touched earlier in the session in the aftermath of the latest rate hike by the Bank of England (BoE).
As of press time (06:00, UTC+3), futures tied to the FTSE 100 index rose 0.3% (22.8 points) to trade above the mid-7600.0 level on the back of a weaker euro (EUR) and limit further losses around the primary index. Additionally, the move follows a gloomy day across Europe and Wall Street as the Bank of England paused its hiking cycle during its September meeting, joining the Federal Reserve (Fed) as the third central bank this week to hold rates in a week dominated by interest rate decisions from central banks in the U.S., U.K., Turkey, Sweden, Switzerland, and Norway.
The Bank of England on Thursday announced it held its policy interest rate at 5.25%, keeping borrowing costs at their highest level since 2008, as policymakers opted for a wait-and-see approach following the latest inflation and labor data, which suggested that the accumulated impacts of previous policy tightening might be taking effect. It was the first pause in policy tightening in nearly two years, following the central bank's unprecedented 515 bps hikes. Policymakers further reiterated their commitment to tightening policy further if deemed necessary.
Following the Bank of England interest rate decision announcement, the sterling pound dropped 0.25% against the dollar to trade a few pips above the five-month low touched early Thursday before late retreating to close with modest losses. In comparison, the main index rose 0.82% to register one of its most significant intraday gains in more than two months and trade slightly below a four-month high touched late last week before retreating to close with heavy losses.
Thursday's decision was somewhat expected by investors after the annual inflation rate in the U.K. dropped to 6.7% in August 2023 from 6.8% in July, falling below the market consensus of 7.0%. Every month the inflation rate in the U.K. rose by 0.3% in August.
UK FTSE 100 Index Movers
Here are the top UK FTSE 100 index movers today before the bell, a week in which the primary index is set to close with modest losses.
Top Gainers⚡
- J.D. Sports Fashion Plc. (London: J.D.) rose 8.99%/11.95 points to trade at £144.90 per share.
- NEXT, Plc. (London: NXT) added 3.43%/244.0 points to trade at £7350.0 per share.
- Kingfisher, Plc. (London: KGF) gained 2.18%/4.70 points to trade at £220.40 per share.
Top Losers💥
- Ocado Group, Plc. (London: OCDO) lost 19.87%/160.60 points to trade at £647.80 per share.
- Flutter Entertainment, Plc. (London: FLTRF) declined 3.49%/510.0 points to trade at £14105.0 per share.
- Croda International, Plc. (London: CRDA) shed 0.58%/0.390 points to trade at £4881.0 per share.
Market participants now look forward to the release of the Core Retail Sales (MoM) (Aug) data report, Manufacturing PMI, Services PMI, and Composite PMI preliminary data reports, respectively. The data reports, and broader market risk sentiment will influence the Sterling Pound and provide the UK FTSE 100 Index directional impetus.
Technical Outlook: Four-Hour UK FTSE 100 Index Price Chart
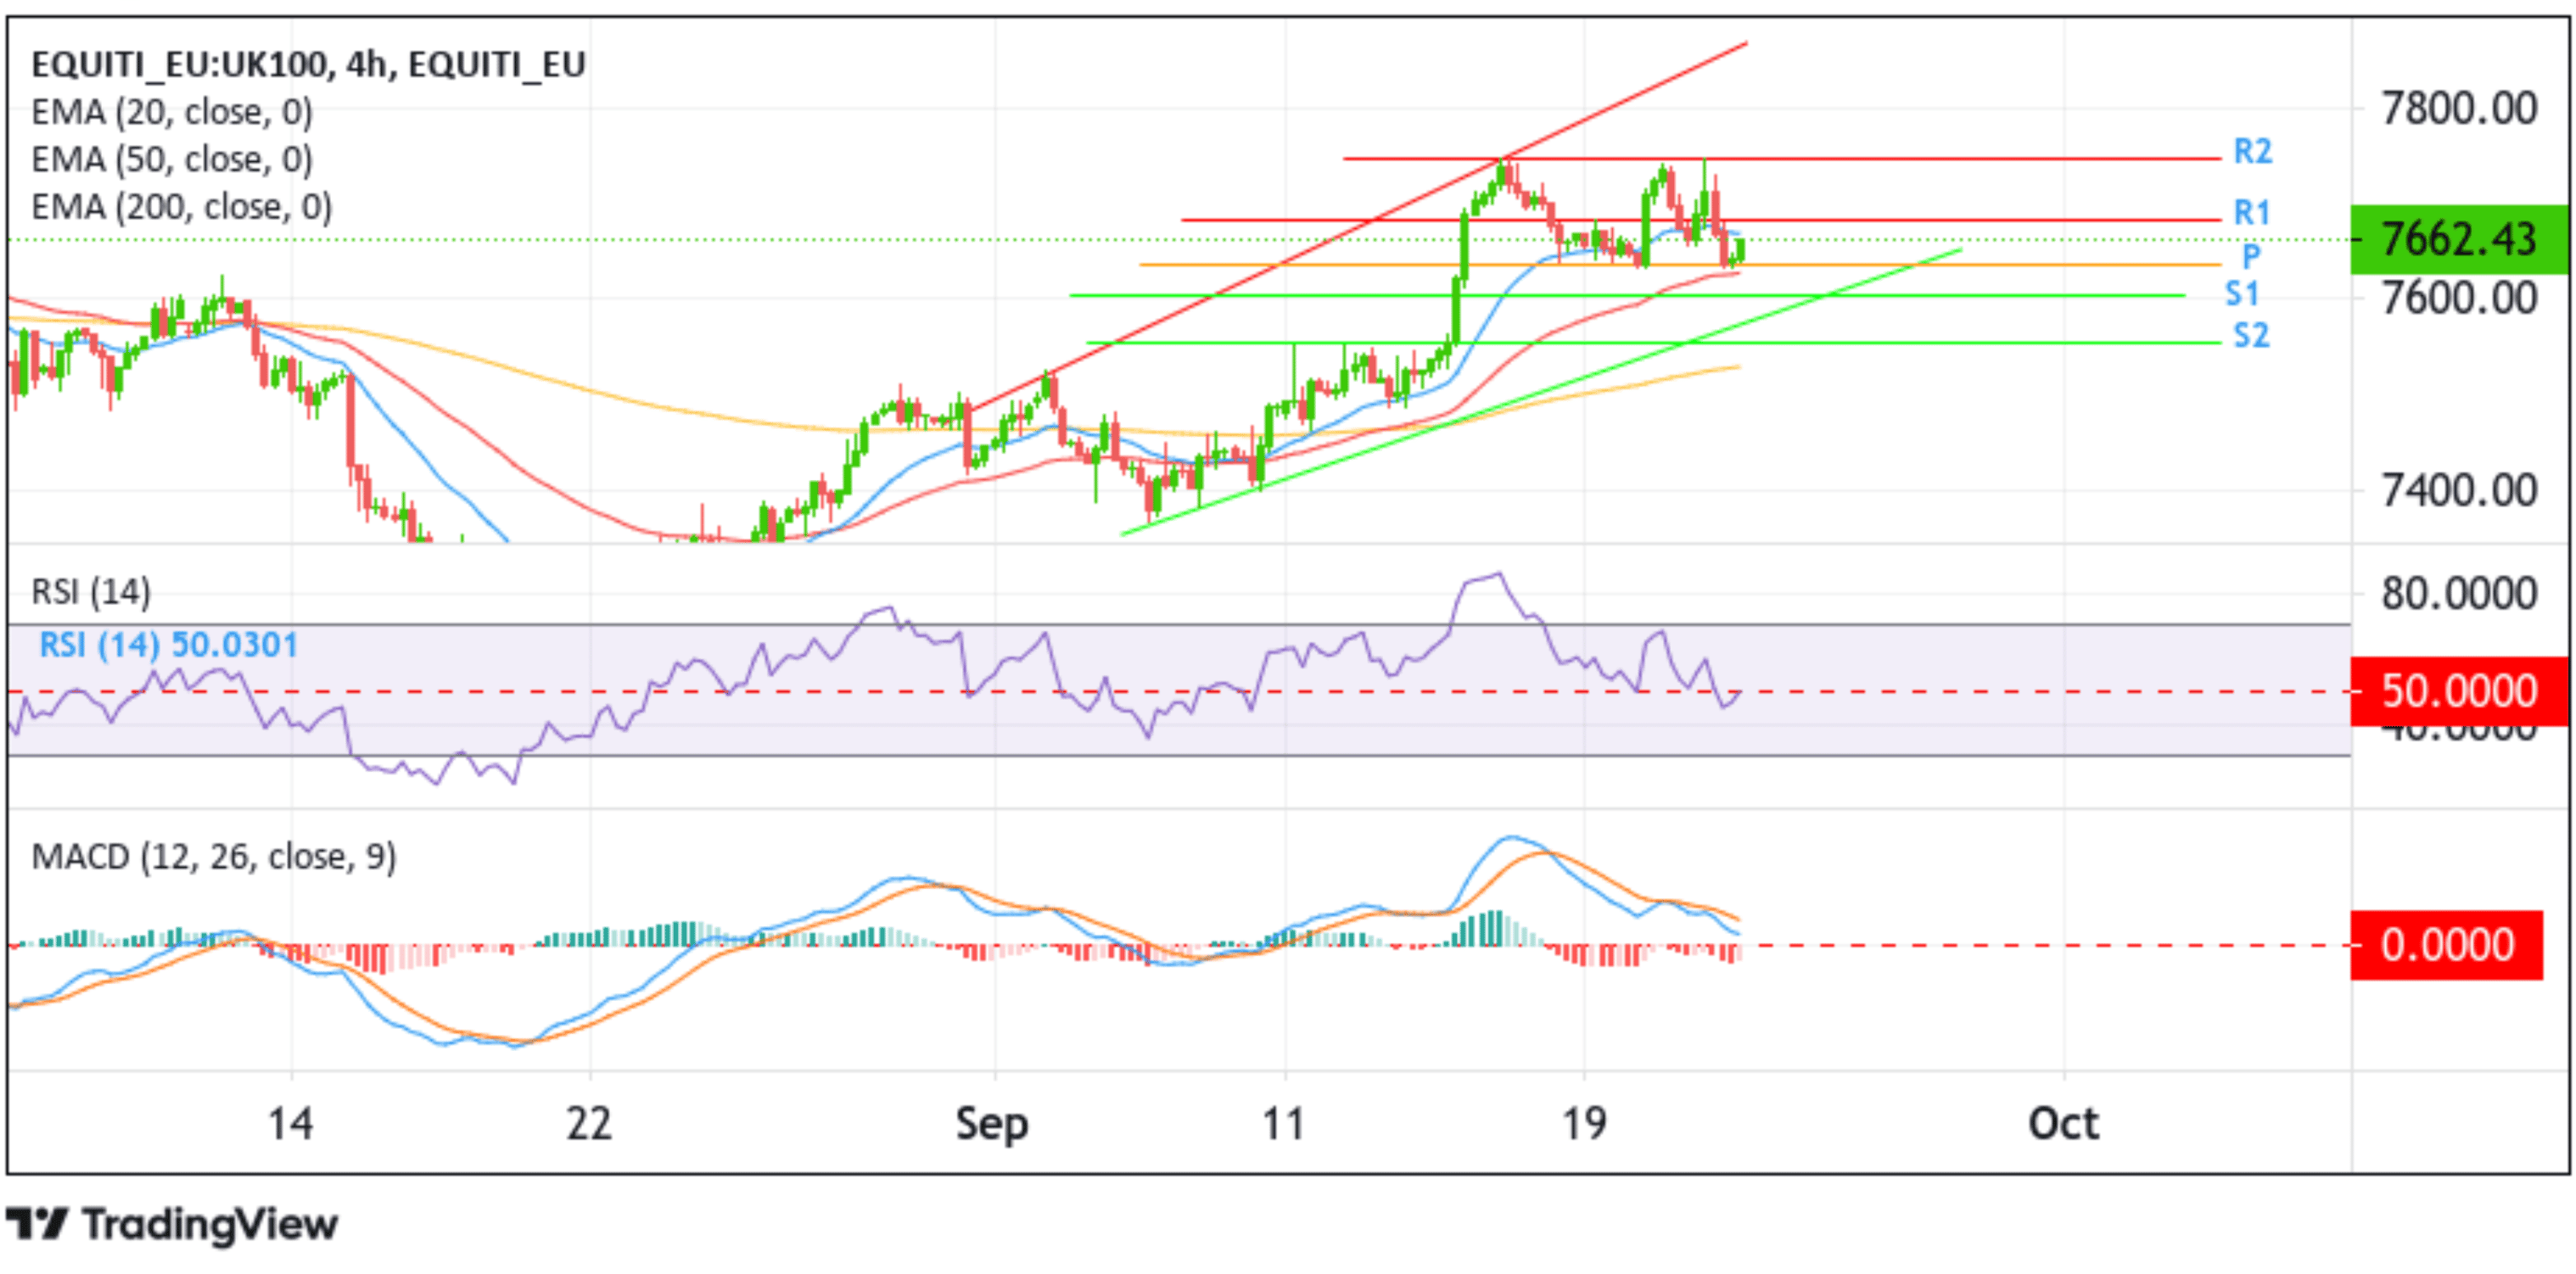
From a technical standpoint, some strong follow-through buying would face initial resistance at the 7681.80 level (R1- first resistance level). A clean break above this barrier would pave the way for the price to rise toward the 7746.71 ceiling. If the price pierces this barrier key resistance level (R2) in the coming sessions, upside momentum could pick up, paving the way for a move toward the resistance level plotted by an ascending trendline extending from the early-September 2023 swing high. A subsequent break (bullish price breakout) above this resistance level would reaffirm the bullish bias and pave the way for more gains around the main index.
The Moving Average Convergence Divergence (MACD) indicator on the chart is in the dip-positive territory, suggesting the continuation of the bullish price action. If the RSI(14) oscillator at 50.0301 also moves further above its signal line in the coming sessions, it would add credence to the bullish bias. Nevertheless, the bullish outlook is validated by the acceptance of the price above the technically strong 200-day (yellow) Exponential Moving Average (EMA) at the 7458.55 level. Furthermore, the 50 (red) and 200 (yellow) day EMA crossover (Golden cross) at the 7463.47 level supports the bullish thesis.
On the other hand, if dip-sellers and tactical traders jump back in and trigger a bearish reversal, initial support appears at the 7636.39 level (pivot point). A subsequent breach below this level would act as a fresh trigger for sellers to push down the price, paving the way for a drop toward the 7603.07 support level (S1). If sellers manage to breach this floor, the price could drop further toward the support level plotted by an ascending trendline extending from the early-September 2023 swing low. A convincing move (bearish price breakout) below this support level would see the main index accelerate its decline toward the next support level (S2) at 7555.83.