UK FTSE 100 Futures Index Pares BOE- Interest Rate Inspired Gains, Moves Back Below $7750.00 Level


- FTSE 100 futures index rebounds from YTD high during mid-Asian, settles below $7750.00 level
- Bank of England (BoE) Raises rates by 25bps as per market expectations and reverses recession calls
- Polymetal Int plc (LON: POLYP) heads the list of top gainers this week, while BP plc (LON: BP) heads the list of top losers

The FTSE UK, 100 futures index edged lower on Friday during the second part of the Tokyo session, rebounding from its session high touched earlier on Friday after struggling to extend the modest rebound from the $7678.6 level in the aftermath of the latest rate hike by the Bank of England (BoE). As per press time (06:00, UTC+3), futures tied to the FTSE 100 index declined 0.09% to trade at $7746.9, reversing back some of its earlier gains on Friday after rising by 0.15% in the after-trading hours. The move follows a gloomy day across Europe and Wall Street as the Bank of England raised its overnight lending rate to its highest level in a decade while providing further guidance of more interest rate hikes that could be incoming in the coming months.

Following the Bank of England interest rate decision announcement, the sterling pound and British gilt yields fell to their lowest in a day. At the same time, the blue-chip FTSE 100 index surged more than 0.65%/50.4 points to close at $7745.5 on Thursday after briefly reaching its lowest level five weeks earlier during the New York trading session. The Bank of England on Thursday hiked interest rates by 25bps to 4.5% in May 2023, marking the twelfth consecutive rate increase, in line with market expectations. Borrowing costs are now at fresh highs not seen since 2008 as the central bank continues to battle double-digit inflation. The central bank sees inflation falling to 5.1% in Q4 2023, compared to 3.9% in the February forecast and no longer expects the U.K. economy to enter recession this year, according to the updated growth forecasts in its accompanying Monetary Policy Report.
The BoE Policy Makers confirmed they would continue to closely monitor indications of persistent inflationary pressures, including the tightness of labour market conditions and the behaviour of wage growth and services price inflation. If there were to be evidence of more persistent pressures, further tightening in monetary policy would be required.
Top Gainers and Losers for the week
Here are this week's top FTSE 100 index movers, a week in which the index is set to close with modest losses.
Top Losers
Europe's largest bank HSBC Holdings plc (LON: HSBA) and energy giant BP plc (LON: BP), lost 1.2% and 1.9%, respectively, as they were trading without the entitlement for dividends.
Top Gainers
Helping cut losses were gains in defensive stocks like mining giant Polymetal Int plc (LON: POLYP) and materials company Smurfit Kappa Group plc (LON: SKG) which gained 7.82% and 3.71%, respectively, after trading hours.
Technical Outlook: Four-Hours UK 100 Price Chart
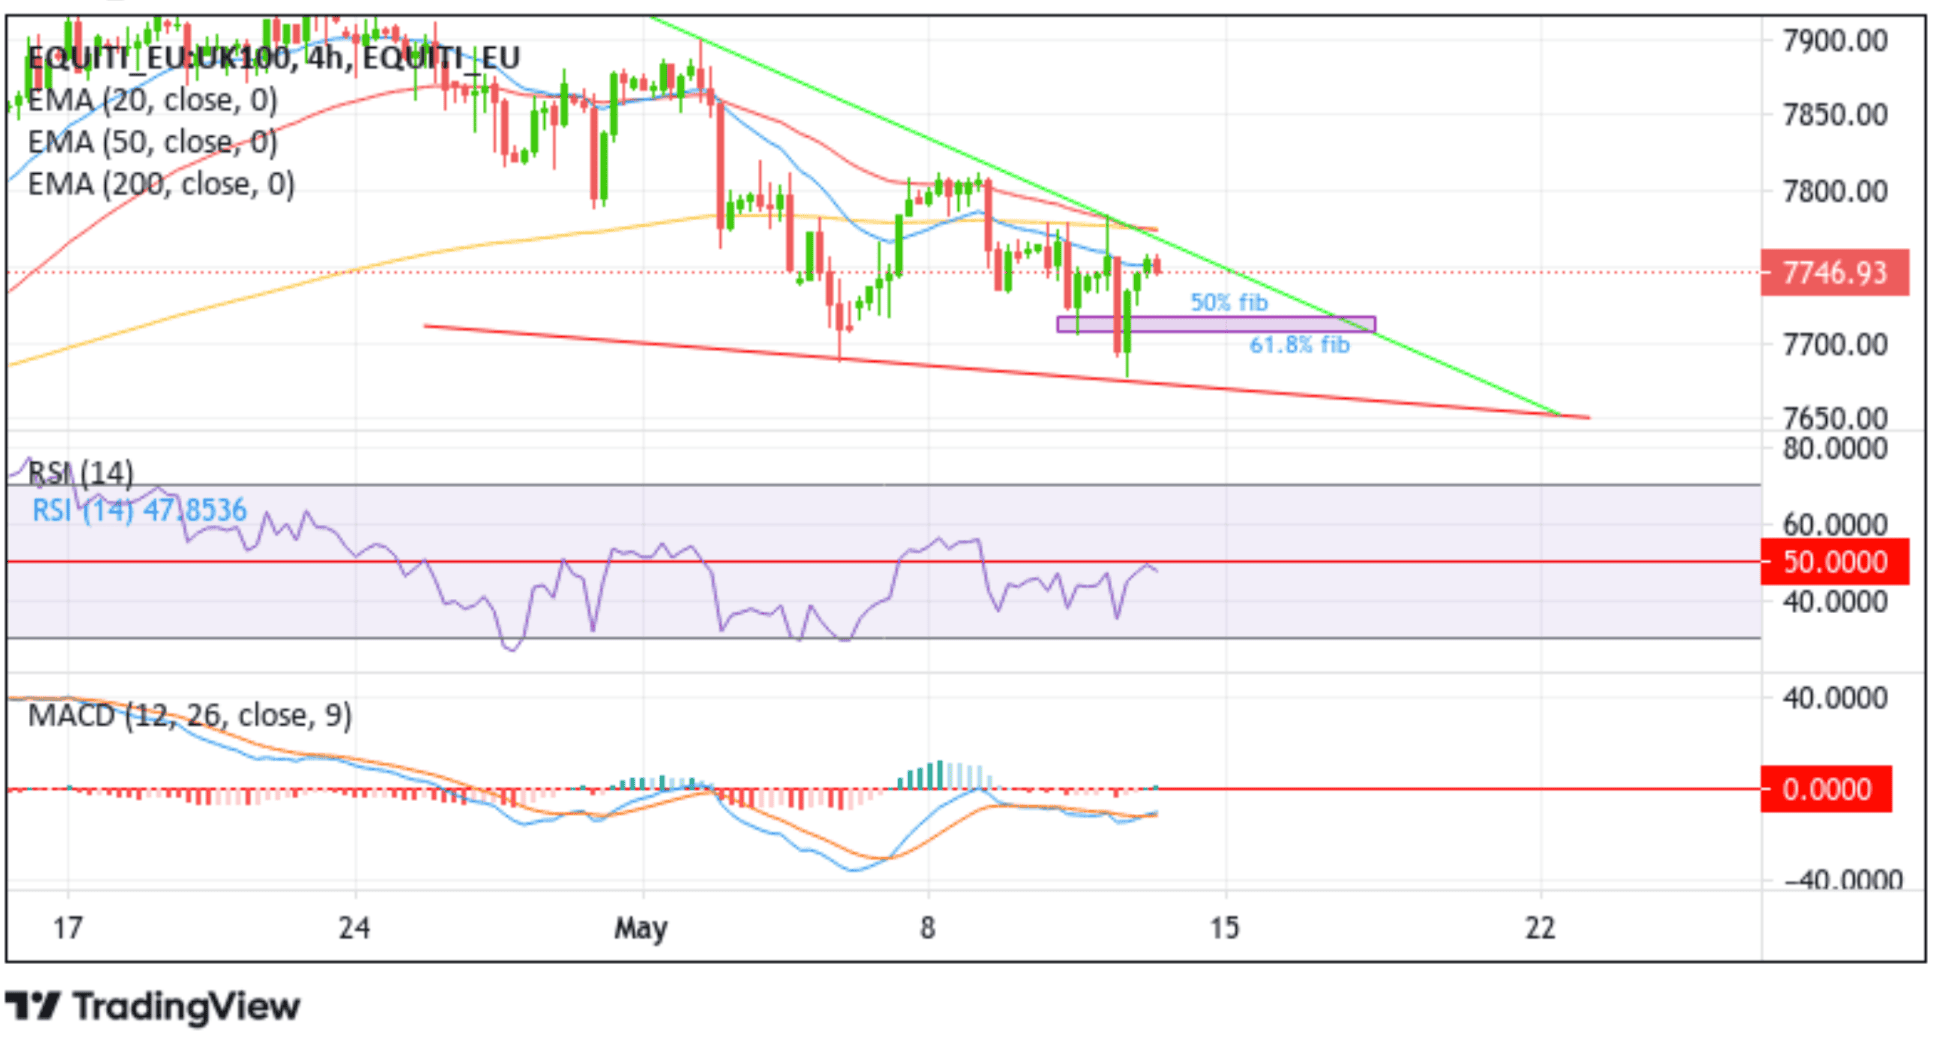
From a technical standpoint, a further increase in selling pressure would confront stiff resistance at 50% and 61.8% Fibonacci Retracement levels at 7717.52 and 7708.19 levels, respectively. Sustained weakness below this level could pave the way for an extended decline beyond the 7700.00 psychological mark en route to the key support level plotted by a descending trendline from the early-May 2023 swing low. If sellers manage to breach this floor, downside momentum could pick up pace paving the way for a further southside move toward the 7660.04 support level.
The technical Oscillators on the four-hour chart are holding in bearish territory. They are still far from being in the oversold zone, portraying a bearish bias and suggesting a continuation of the downward trajectory. The bearish bias is further supported by the price's acceptance below the 200-day Exponential Moving Average (EMA) at the 7791.4 level.
On the flip side, if dip-buyers and tactical traders jump back in and trigger a bullish reversal, initial resistance appears at the 20-day (blue) Exponential Moving Average (EMA) at the 7749.5 level. Sustained strength above this level would pave the way for a rally toward the key resistance level plotted by a descending trendline extending from the early-May 2023 swing high. A convincing break above this level (bullish price breakout) would pave the way for an extended rally toward confronting the 7781.3 resistance confluence level (50-day (red) and 200-day (yellow) crossover). If sidelined buyers join in from this seller congestion zone, it will rejuvenate the bullish momentum, provoking an extended rally beyond the 7800.00 psychological mark en route to the 7811.7 resistance level.