USD/JPY Pares U.S Fed Inspired Gains And Moves Back Below 148.400 Mark On Weak U.S. Dollar


Key Takeaways:
- USD/JPY pair witnessed fresh selling on Thursday during the mid-Asian and eased from a nine-month high
- Speculations that the BoJ will shift from its ultra-loose monetary policy setting extend some support to the Yen
- Fed decided to hold rates during its September meeting but signalled there could be another hike this year, extending support to the buck and suggesting the path of least resistance for the USD/JPY cross is to the upside

The USD/JPY cross came under renewed selling pressure on Thursday during the mid-Asian session and eased from a nine-month high/148.459 level earlier. The pair is now trading below the 148.200 mark and has managed to reverse most of its earlier gains. A fresh leg down in U.S. Treasury bond yields forced the U.S. dollar to trim part of intraday gains and ease from a six-month high/105.688 level touched earlier today and was seen as a key factor that limited further upside moves for the USD/JPY cross. Additionally, the modest bounce in the U.S. equity markets on Thursday during the Asian session was another factor that weighed on the buck and helped cap the upside for the USD/JPY cross.
Despite the combination of negative factors, the greenback continues to draw support from firm market expectations that the Federal Reserve (Fed) will lift interest rates by at least 25 basis points (bps) before the end of this year, which in turn suggests, in the long run, the path of least resistance for the USD/JPY cross is to the upside.
The bets were further reaffirmed after the Federal Reserve on Wednesday announced it had left its federal funds rate unchanged, ranging from 5.25% to 5.5% during its September meeting, matching market expectations but signalled there could be another hike this year. Projections released in the dot-plot showed the likelihood of one more increase this year, then two cuts in 2024, with policymakers now seeing the fed funds rate at 5.6% this year, the same as in the June projection, while it is seen higher at 5.1% in 2024, compared to 4.6% seen in June.

Moreover, the Fed Chair's speech during the post-interest rate decision announcement (FOMC conference) was translated by many investors as somewhat hawkish after he indicated that the central bank would "proceed carefully" in hiking rates further. However, it has more work to do as it fights sticky inflation. He called a soft landing for the economy plausible but not the Fed's baseline case.
That said, Wednesday's decision was widely expected after a U.S. Bureau of Labor Statistics (BLS) report released early this month indicated a gradual easing of labor market conditions. The bets were further lifted after another BLS report released mid-this month showed the annual core consumer price inflation rate in the United States, which excludes volatile items such as food and energy, fell to its lowest level in two years. That said, speculations that the Bank of Japan (BoJ) will shift from its ultra-loose monetary policy setting and fears that Japanese authorities will intervene to shore up the Yen might help extend the bearish pullback.

However, the current price action suggests any further downtick is still seen as a buying opportunity. Apart from this, the generally positive sentiment around U.S. Treasury Bond Yields continues to support the greenback and would help cap further USD/JPY downtick moves. Additionally, the Japanese Yen (JPY) continues to be weighed down by fresh, disappointing Japan macro data, which showed Japan's trade deficit decreased sharply to JPY 930.5 billion in August 2023 from JPY 2,790.4 billion in the same month a year earlier, compared with market estimates of a shortfall of JPY 659.1 billion.
As we advance, investors look forward to the U.S. docket featuring the release of the Philadelphia Fed Manufacturing Index report (Sep), Initial Jobless Claims for the previous week, and the Existing Home Sales report (MoM) (Aug), among other important U.S. macro data.
Technical Outlook: Four-Hour USD/JPY Price Chart
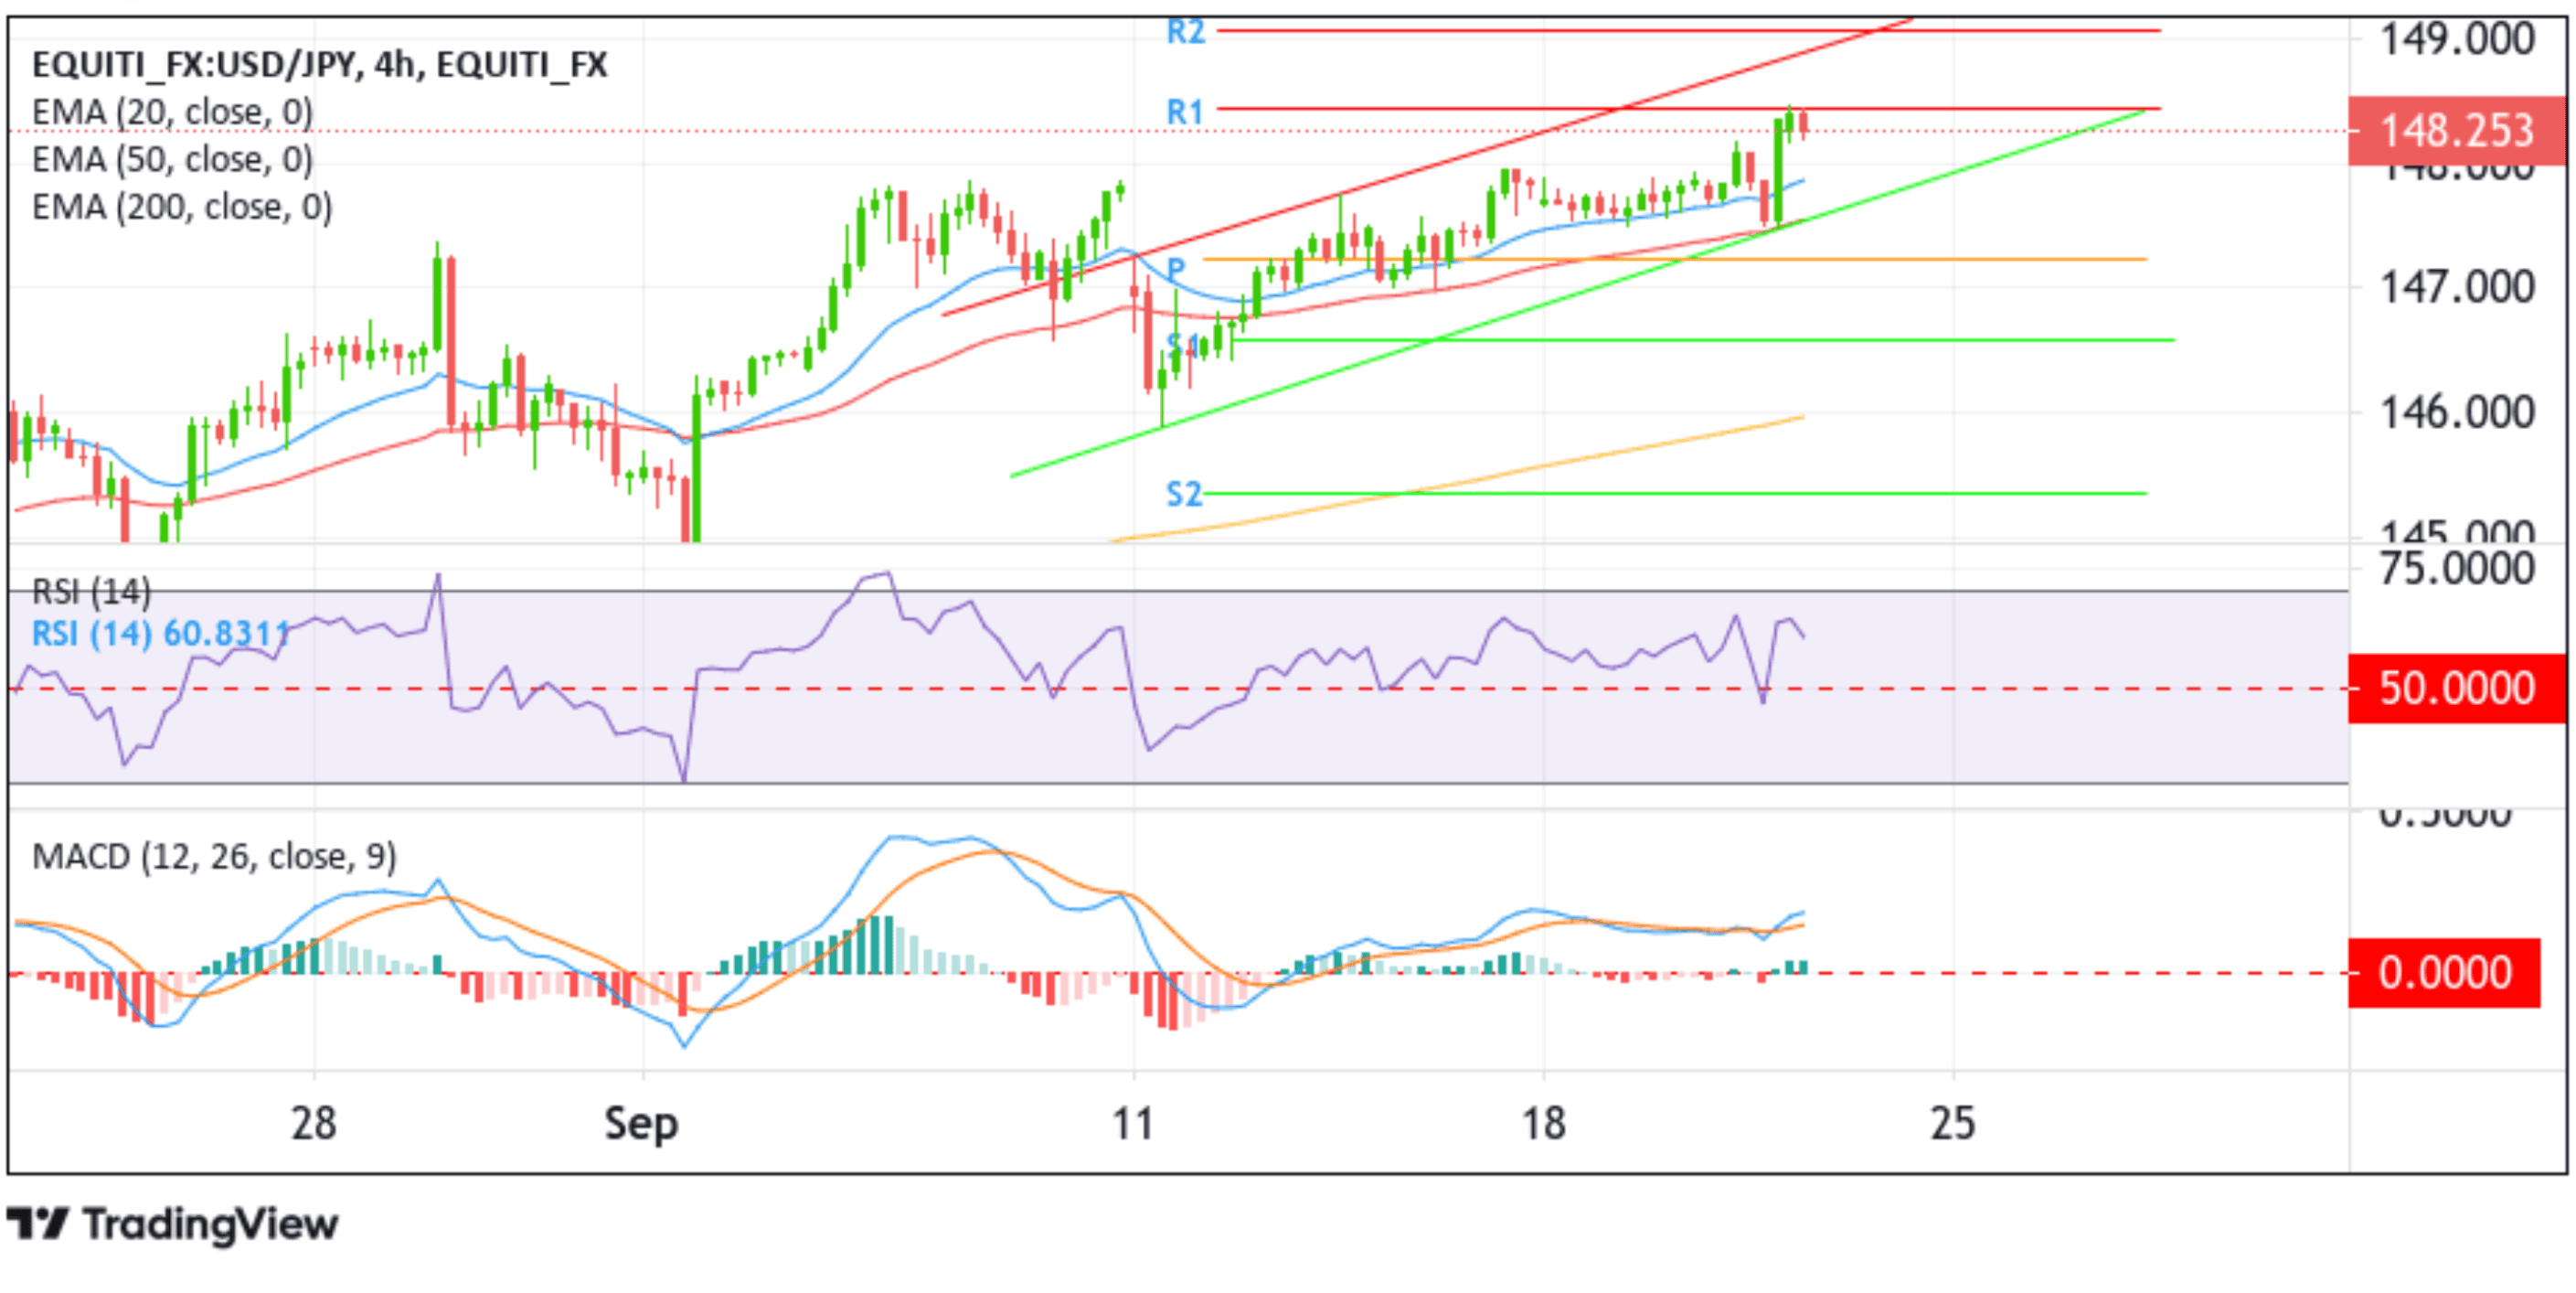
From a technical standpoint, the price has extended the modest bounce from the vicinity of the 148.431 level (rejection from the key resistance level- R1/first resistance level). However, further downticks seem elusive as the USD/JPY cross remains under heavy bullish pressure as the technical oscillators on the chart (RSI (14) and MACD) are in dip-positive territory, suggesting continuing the bullish price action this week. Additionally, the acceptance of the price above the technically strong 200-day (yellow) Exponential Moving Average (EMA) at the 140.671 level supported the case for further downside moves. Furthermore, the 50 (red) and 200 (yellow) day EMA crossover (Golden cross) at the 140.739 level validates the bullish thesis. It suggests the current bearish pullback runs the chance of fizzling out sooner or later and that further downtick could still be seen as Buy opportunities.
If buyers jump back in and catalyze a bullish reversal, initial resistance comes at the R1 (first resistance) level 148.431. On further strength, the focus shifts toward the upper limit of the ascending channel pattern extending from the mid-September 2023 swing low. A subsequent break (bullish price breakout) above this resistance level would reaffirm the bullish outlook and pave the way for moving toward the next resistance level (R2) at 149.087. If the price pierces this barrier, the USD/JPY price could accelerate further toward the 150.00 round mark and, in highly bullish cases, rally toward the 2022 record high at the 151.892 level.