Gold Steadies Above $2040.000 Mark On Softer U.S. Dollar, A Slew Of Key U.S. Macro data Awaited


Key Takeaways:
- Gold (XAU/USD) extended its recovery momentum above the $2043.000 region on Thursday
- Retreating Treasury bond yields amid dovish Fed expectations weigh on the buck
- Upbeat Chinese macro data lend further support to the precious yellow metal
- A slew of key U.S. macro data set to be released today will help determine the next leg of directional move for gold prices

Gold (XAU/USD) extended the overnight bounce from the vicinity of the 2030.747 level/one-week low and rose slightly higher on Thursday during the mid-Asian session to climb above the $2043.000 region, marking a 0.1% daily gain. The precious yellow metal looks set to maintain its bid tone heading into the European session amid the prevalent U.S. dollar selling.
A fresh leg down in U.S. Treasury bond yields amid diminishing doubts over early interest rate cuts by the Federal Reserve saw the U.S. dollar attract fresh selling on Thursday and extend the modest bounce from the vicinity of the $102.726 level touched overnight on Wednesday and moved back below the $102.400 mark, which in turn was seen as a key factor that helped cap the downside for the XAU/USD pair.
This comes after the minutes of the December meeting revealed that many officials seemed satisfied with the recent progress made on the inflation front and deemed cuts appropriate at some point in 2024. However, the minutes also suggested that the Fed intends to maintain a restrictive stance in the short term as uncertainties linger.
"Participants generally stressed the importance of maintaining a careful and data-dependent approach to making monetary policy decisions and reaffirmed that it would be appropriate for policy to remain at a restrictive stance for some time until inflation was clearly moving down sustainably toward the Committee's objective," the minutes stated.
That said, CME's Fed watch tool still shows that Fed fund futures traders have priced in Fed rate cuts as soon as March, with the odds currently standing at 66.5% for a 25bps rate cut.

Further weighing on the buck was the fresh round of mixed U.S. macro data released on Wednesday. A U.S. Bureau of Labor Statistics report released on Wednesday showed the number of job openings decreased by 62,000 from the previous month to 8.790 million in November 2023, marking the lowest level since March 2021 and falling below the market consensus of 8.85 million. It was the third consecutive month of declines in U.S. job openings, reflecting the ongoing easing of labor market conditions.
Elsewhere, the ISM Manufacturing PMI in the U.S. improved slightly to 47.4 in December 2023 from 46.7 in November, which is better than market forecasts of 47.1. Still, the reading pointed to the 14th month of contraction in factory activity, prolonging the most extended period of declining activity since 2000-2001.
That said, the precious yellow metal further drew support from the upbeat Chinese macro data released earlier today, which showed the Caixin China General Service PMI increased to 52.9 in December 2023 from 51.5 in November, beating market expectations of 51.6. It was the 12th straight month of growth in service activity and the fastest expansion since July, mainly boosted by a solid rise in new business.
Additionally, the modest bounce in the U.S. equity markets on Thursday further weighs the buck and helps drive flows toward the non-yielding bullion.
As we advance, investors look forward to the U.S. docket featuring the release of the ADP Nonfarm Employment Change (Dec), Initial Jobless Claims (previous week), and the Services PMI (Dec) data reports. The main focus, however, remains on Friday's U.S. jobs data, popularly known as Nonfarm Payrolls (NFP) data, which is expected to show the U.S. economy created 163K jobs in December last year compared to 199K jobs created in November,
Technical Outlook: Four-Hours Gold Price Chart
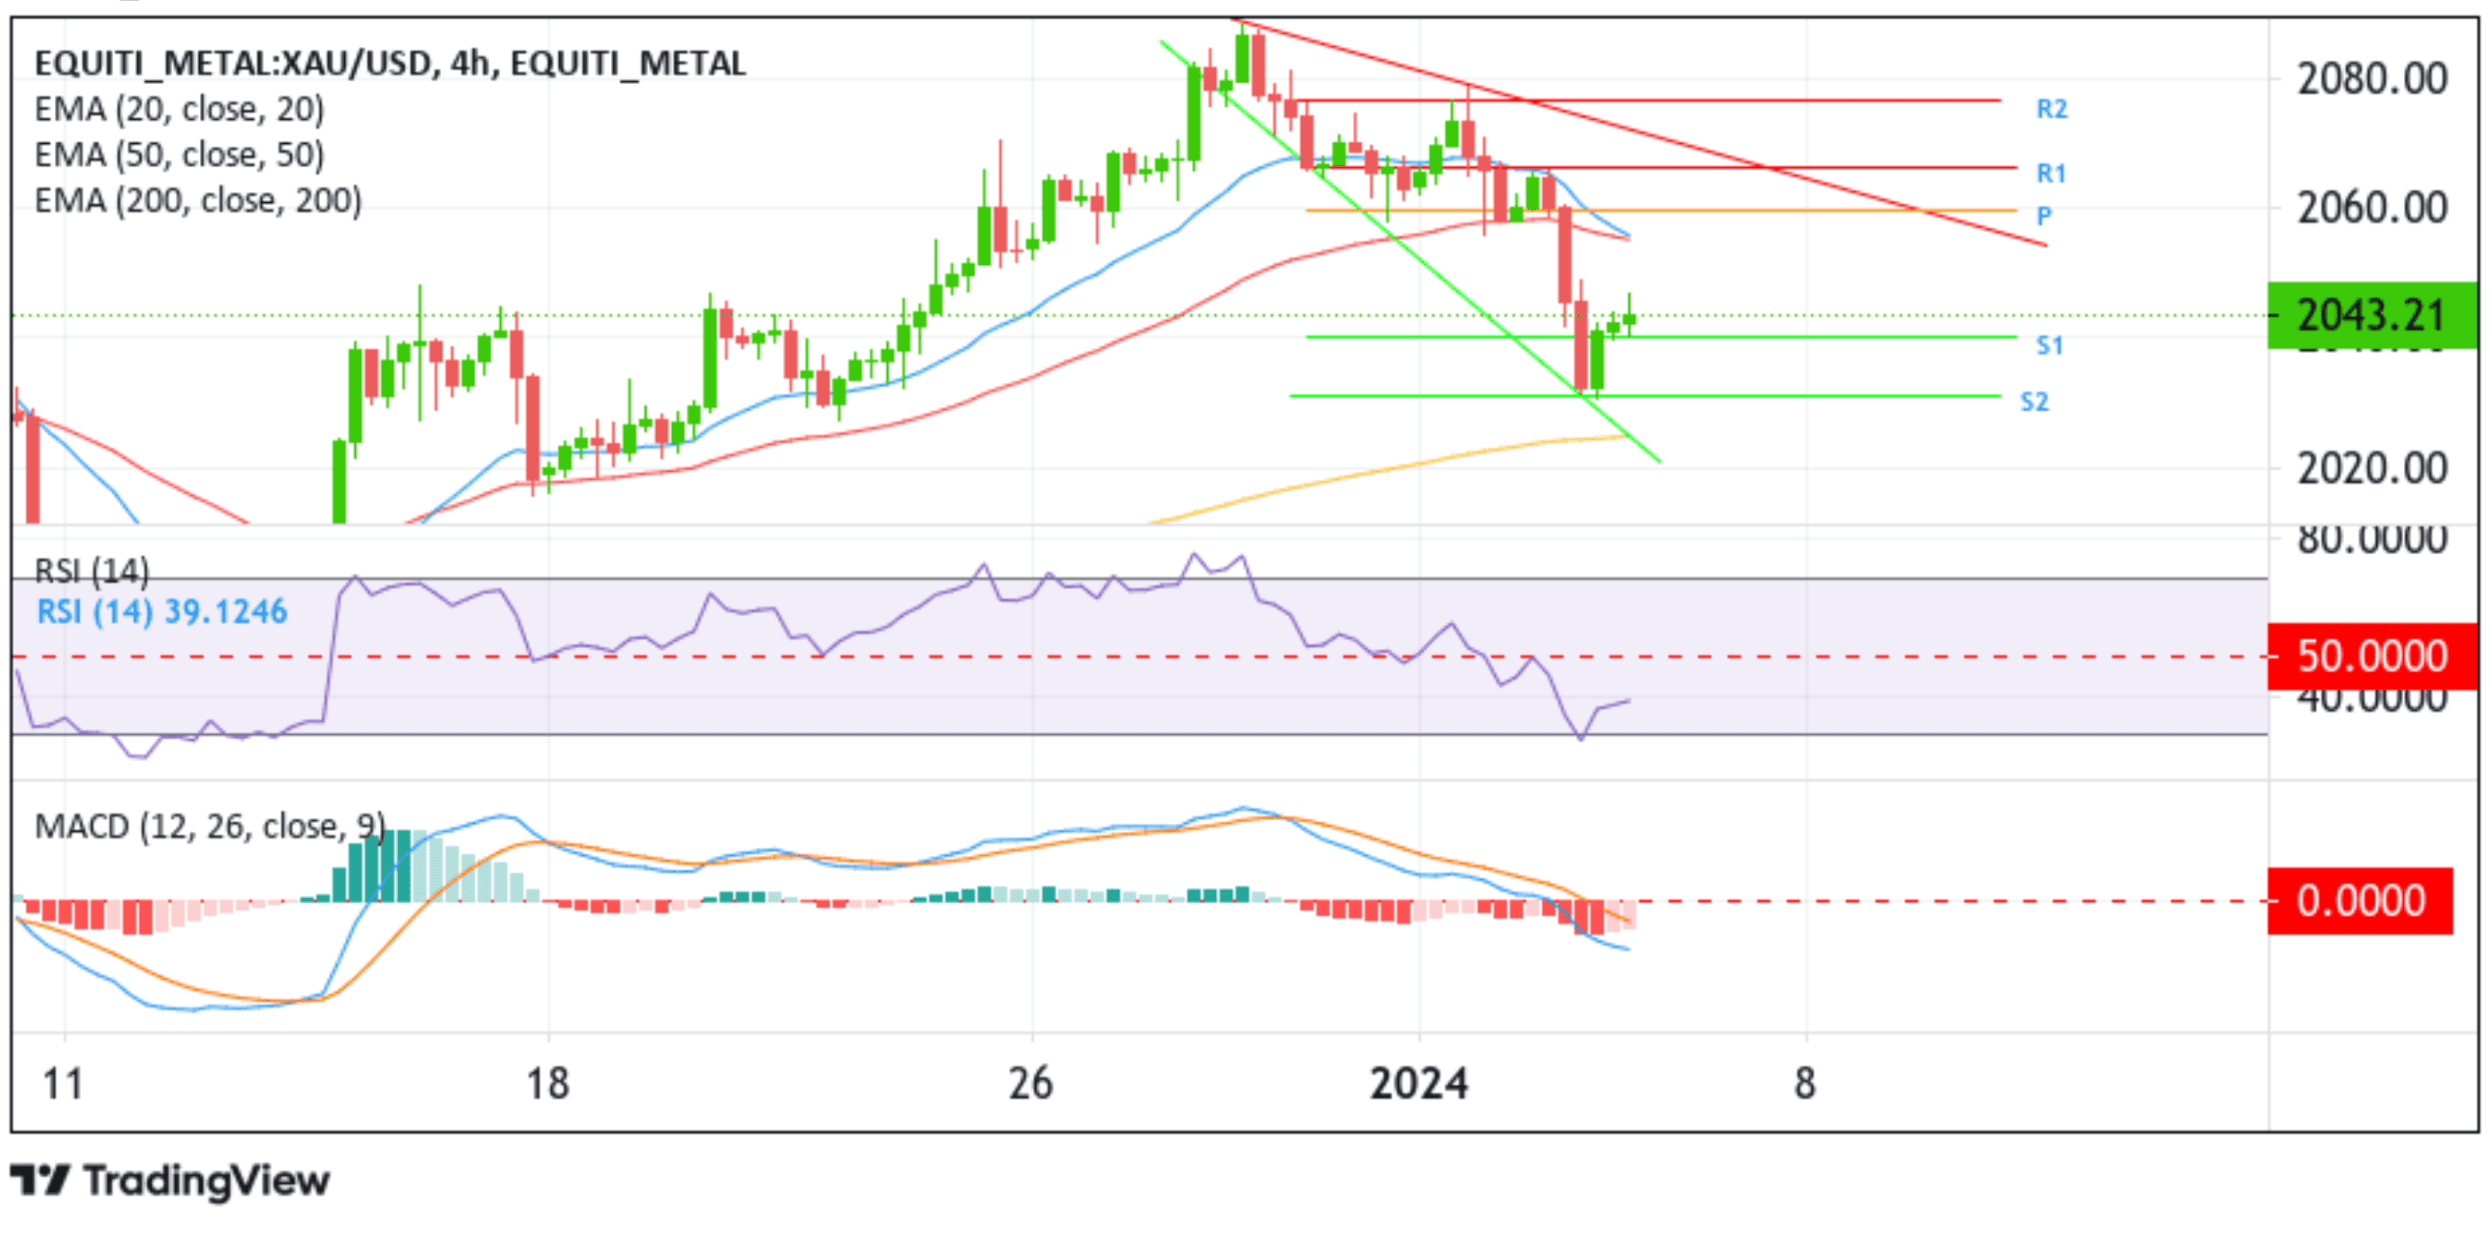
From a technical perspective, a further increase in buying momentum from the current price level will uplift spot prices toward the $2054.68 confluence level as a result of the 20 (blue) and 50(red)-days Exponential Moving Average (EMA) crossover. Acceptance above this level will pave the way for an ascent toward the key pivot level (P) at $2059.41. A convincing move above this level will pave the way for a further extension of the corrective pullback toward the $2066.39 resistance level (R1), about which, if this level fails to defend itself, bulls could extend the bullish momentum towards retesting the key resistance level plotted by a downward-sloping trendline extending from the late-December 2023 swing high. A subsequent break (bullish price breakout) above this level will pave the way for a rally toward the 2076.40 resistance level (R2). Gold could extend its bullish trajectory toward the $2088.12 ceiling in highly bullish cases.
On the flip side, if sellers resurface and spark a bearish turnaround, initial support comes in at $2040.01 (S1). On further weakness, the focus shifts lower to $2030.91, followed by the technically strong 200-day (yellow) EMA level at $2025.00.