Gold Extends Bullish Pullback Above 1984.00 Mark Amid Rising Geopolitical Risks, U.S.GDP (QoQ) (Q3) Eyed


Key Takeaways:
- XAU/USD cross gained positive traction on Thursday and extended the bullish pullback above the 1984.00 mark
- Rising geopolitical risks and market uncertainty boost gold's safe-haven appeal and help exert upward pressure on the XAU/USD cross
- Gold continues to face heavy headwinds stemming from rising U.S. Treasury yields bolstered by hawkish Fed expectations, which might help limit further XAU/USD gains
- Investors look forward to the U.S. docket featuring the release of the GDP (QoQ) (Q3) for fresh XAU/USD directional impetus

Gold extended its sharp bounce from the vicinity of the 1963.476 level touched on Wednesday and ticked higher on Thursday during the Asian session, marking a second day of positive moves in the last five. The precious yellow metal is up 0.72% (14.28 pips) for the day, supported by the ongoing Israel-Gaza War and anticipation of key U.S. economic indicators.
Concerns that the Israel-Palestine conflict could spill over into the broader Middle East region, in turn leading to a major global crisis, saw investors shy away from risk-perceived assets in favor of safe-haven assets, which in turn was seen as a key factor that helped exert upward pressure on gold prices.
This week's incoming data is expected to show a more robust third-quarter Gross Domestic Product (GDP) reading. In contrast, the Fed's preferred inflation gauge, Personal Consumption Expenditure (PCE), is also expected to show a moderate rise in inflation pressures in the U.S. A positive reading from both data reports would give the Federal Reserve (Fed) more headroom to keep interest rates higher for longer, a scenario that bodes poorly for the precious yellow metal.
Alternatively, any softer reading could help cement market expectations that the Fed will keep its benchmark policy rate steady at the current 5.25% to 5.5% range during the November meeting. This could be a tailwind to gold prices and help extend the bullish pullback.
The current gold uptick comes amidst a backdrop of increased manufacturing and service activities in the U.S., contrasting with a decline in the U.K. and eurozone area.
That said, any further gold rally would depend on the implications of the ongoing Israel-Palestine war, which is now in its third week. Apart from this, the U.S. Treasury bond yields' strength would also be crucial to contributing to the sentiment around the XAU/USD pair. Currently, the U.S. Treasury bond yields bolstered by hawkish Fed expectations remain elevated and extend support to the buck, which warrants caution to traders against submitting aggressive bullish bets.
As we advance, investors look forward to the U.S. docket featuring the release of the GDP (QoQ) (Q3), Core Durable Goods Orders (MoM) (Sep), and the Initial Jobless Claims (previous week) data report all set for release during the early north-American session.
Technical Outlook: Four-Hour Gold Price Chart
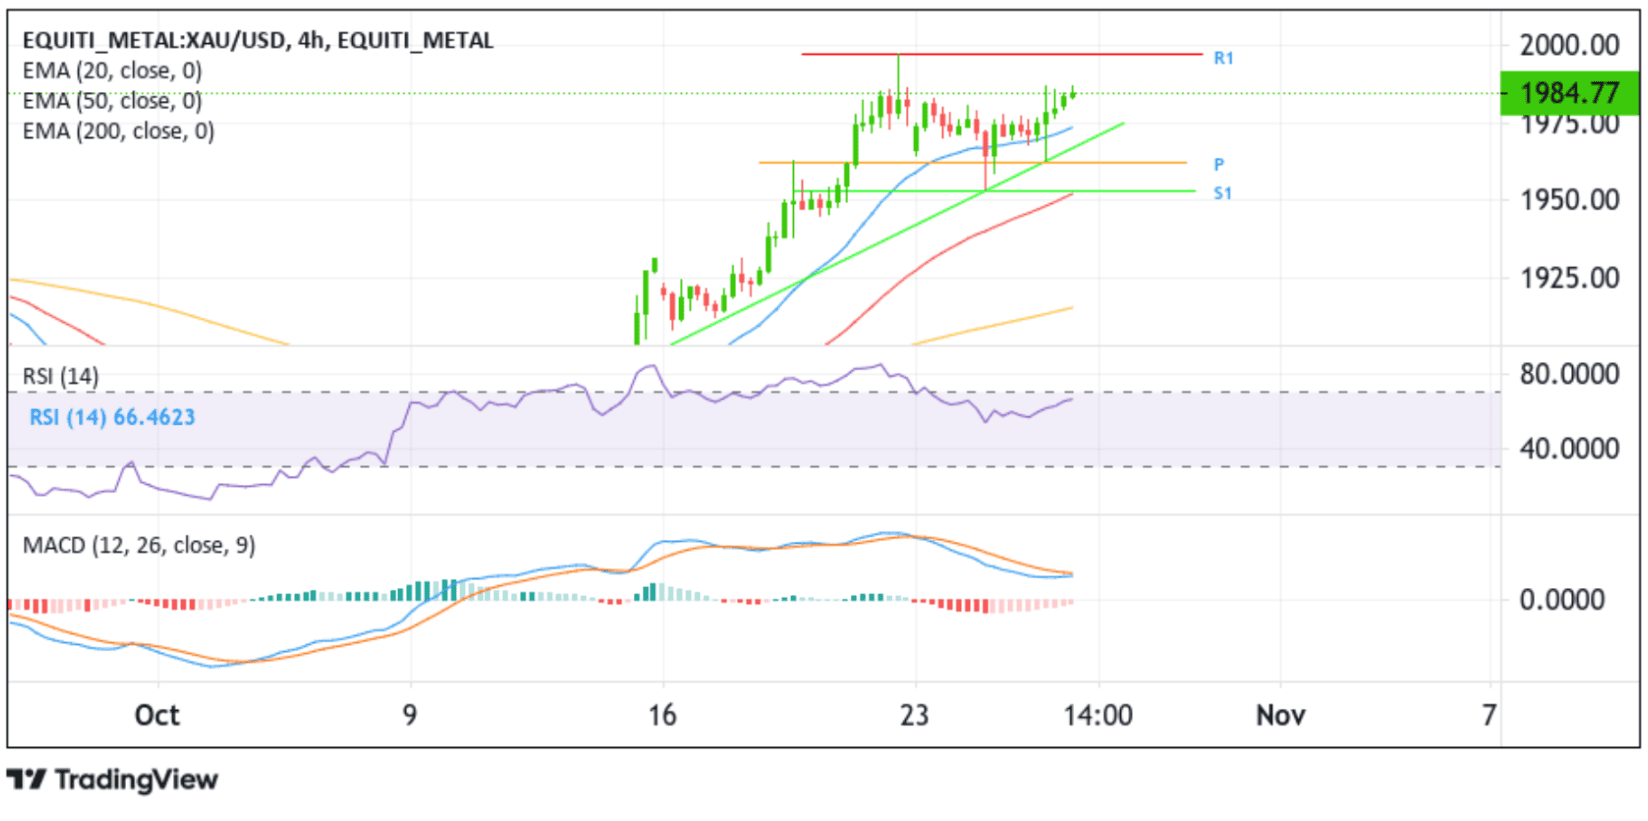
From a technical standpoint, XAU/USD cross-extended the sharp pullback from the vicinity of the 1963.476 level after finding support from the key support level plotted by an ascending trendline extending from the mid-October 2023 swing low. Some follow-through buying from the current price level would uplift spot prices toward the immediate hurdle at the 1997.04 level. A clean break above this resistance level would reaffirm the bullish outlook and pave the way for further gains around the XAU/USD cross.
All the technical oscillators (RSI (14) and MACD) on the chart are in dip-positive territory, suggesting continuing the bullish price action this week. The bullish outlook is firmly supported by the acceptance of the price below the technically strong 200-day (yellow) Exponential Moving Average (EMA) at the 1887.44 level. Additionally, the 50 (red) and 200 (yellow) day EMA crossover (golden cross) at the 1893.09 level further credence to the bullish thesis.
On the flip side, if dip-sellers and tactical traders jump back in and trigger a bearish reversal, initial support comes at the ascending trendline extending from the mid-October 2023 swing low. A subsequent break below this support level will pave the way for a drop toward the 1962.12 pivot level (P). A convincing move below this level will pave the way toward the 1953.22 support level (S1), below which the precious yellow metal could fall into dipper losses.
