Gold Rebounds Modestly And Moves Back Above The 1961.00 Mark But Lacks Bullish Conviction Amid Stronger U.S. Dollar


Key Takeaways:
- Gold (XAU/USD) rebounded modestly during the Asian session and moved back above the 1961.00 mark
- Back-to-back softer U.S. inflation figures cement market expectations that the Fed is done with its rate-hiking cycle
- The firmer tone around the U.S. dollar might help limit further gold gains in the meantime
- The markets look forward to a slew of key U.S. macro data and Fed officials' speeches for gold directional impetus

Gold (XAU/USD) witnessed fresh demand on Thursday during the Asian session and bounced off from an intra-day dip from the vicinity of the 1956.610 level touched earlier in the session. As of press time, the precious yellow metal is placed around 1961.20 area, up 0.09% (178.4 pips) for the day, and looks to have snapped bears attempted pullback from the vicinity of 1975.442 last touched on Wednesday.
Increased market bets that the Fed is done with its rate-hiking cycle continue to entice gold buyers who placed new buy orders earlier today, which saw the precious metal make a decisive pullback after declining the previous day weighed by a stronger U.S. dollar, bolstered by better-than-expected U.S. retail sales and N.Y. Empire State Manufacturing Index prints, which rose to -0.1% and 9.10, respectively, in October, against market expectations of -0.3% and -2.80 drop.
Markets seem convinced the Fed will uphold its status quo during the December meeting after a second inflation report shows inflation pressures in the U.S. are softening further. Producer prices in the U.S. increased 1.3% year-on-year in October 2023, less than market expectations of 1.9% and easing from a 2.2% rise in September. Every month, the producer price index for final demand declined -0.5% in October, the most significant decrease since April, and came below market expectations of 0.1%, easing from a 0.4% rise in September. Excluding food and energy, core producer prices in the United States remained unchanged in October 2023 compared to the previous month. This is compared with market expectations of a 0.2% rise.
The better-than-expected U.S. producer inflation report comes on the heels of another cooler-than-expected U.S. consumer inflation report, which, together with slowing job and wage growth, fully reinforces market expectations that the Fed is done with its monetary policy tightening campaign. CME's Fed watch tool shows that Fed fund futures traders have priced in nearly a 3% chance that the Fed will hike interest rates during the December meeting.
That said, further lending support to the precious yellow metal is the mixed Chinese macro data released on Wednesday, which showed China's industrial production and retail sales figures all beat market expectations. In contrast, fixed asset investment figures came below market consensus. However, the stronger sentiment surrounding the buck might help limit further upside moves around the XAU/USD cross for the time being.
As we advance, gold traders look forward to the U.S. docket featuring the release of the Initial Jobless Claims (previous week), the Philadelphia Fed Manufacturing Index (Nov), and the Industrial Production (YoY) (Oct) data reports. Investors will look for cues from the speeches of several Fed officials later in the day.
Technical Outlook: Four-Hours Gold Price Chart
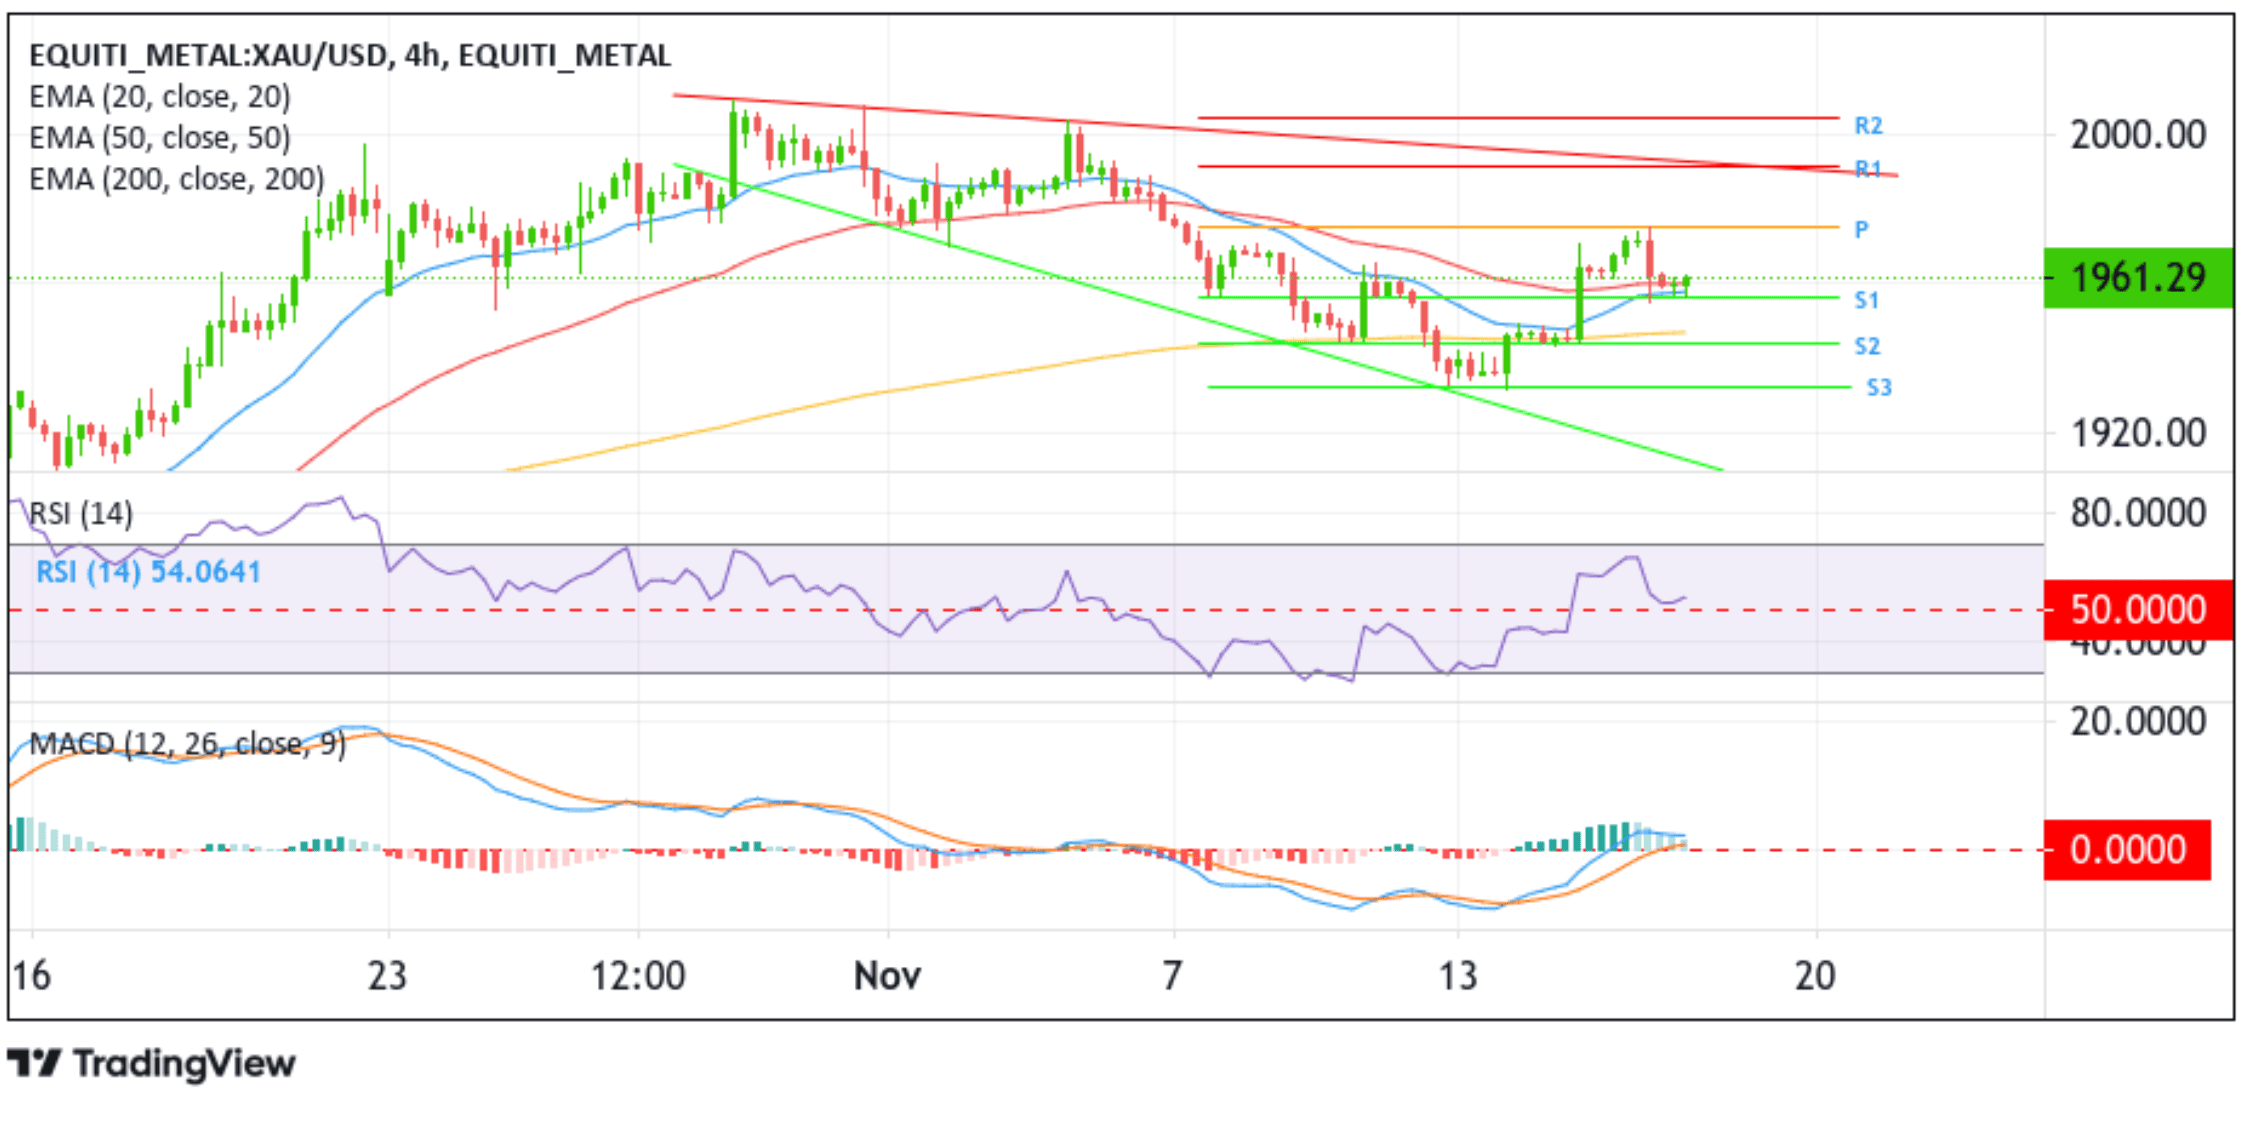
From a technical perspective, gold rebounded modestly from the vicinity of the 1956.610 level (S1) and rose modestly after that to trade above the 1961.00 mark. A further increase in buying pressure will uplift spot prices toward the key pivot level (p), which coincides with the 61.8% Fibonacci retracement level at the 1976.43 level, which buyers failed to break above on Wednesday. This time, A convincing move above this level would reaffirm the bullish thesis and pave the way for a rally toward the 1992.57 resistance level (R1), which sits above the key resistance level plotted by a descending trendline extending from the late-October 2023 swing high. Sustained strength above these levels will pave the way for a move toward the 2000.00 round mark, about which, if buyers find acceptance above this mark, gold could extend its bullish trajectory toward the 2008.88 ceilings.
On the flip side, if sellers resurface and catalyze a bearish turnaround, initial support comes in at the 1956.610 level. On further weakness, the focus shifts lower to the 200-day (yellow) Exponential Moving Average (EMA) at the 1946.42 level. If sellers manage to breach this barrier, downside momentum could pick up pace, paving the way toward the 1943.51 level (S2), followed by the 1934.06 level (S3).
