Gold Retreats Back Below 2032.00 Mark Upon Failure To Find Acceptance Above Multi-Week-Old Descending Trend Channel


Key Takeaways:
- Gold (XAU/USD) extended its bounce from the key resistance level and dropped below the 2032.00 mark
- A fresh leg-up in U.S. Treasury bond yields offered some support to the greenback and helped cap the upside for the XAU/USD cross
- Rising geopolitical tensions continue to lend support to the dollar-denominated commodity
- Markets await the release of a slew of key U.S. macro data for fresh directional impetus; the focus, however, remains on the Fed's decision and NFP
Gold (XAU/USD) extends a sharp bounce from a multi-week-old descending trend channel and drops below the 2032.00 mark on Tuesday during the early Asian session. The precious yellow metal now looks set to maintain its offered tone heading into the European session.
A fresh leg-up in U.S. Treasury bond yields offered some support to the greenback and turned out to be a key factor that capped the upside for the XAU/USD pair.
Apart from this, the modest rebound in the equity markets also turned out to be another factor acting as a tailwind for the safe-haven greenback and helped limit further gains around the non-yielding bullion.

Furthermore, the buck continues to be supported by diminishing odds of the Federal Reserve's (Fed) more aggressive policy easing in 2024, another factor acting as a headwind to the precious commodity.
Markets seem convinced that the Fed will leave rates unchanged during the March meeting and start cutting rates during the third quarter of 2024 after several influential FOMC members over the past few weeks voiced their concerns about early rate cuts, warning that despite progress made in tackling inflation, markets have gotten ahead of themselves in terms of expectations for spring rate cuts.
Moreover, a slightly hotter-than-expected inflation data report released last Friday showed inflation in the U.S. rose in December, further reaffirming market expectations that the Federal Reserve might prolong its hawkish stance into the second quarter, helping push back further the idea of early rate cuts.
The U.S. core PCE data joins a string of positive U.S. macro data released this month to cement market expectations that the Federal Reserve will cut rates by the middle of 2024. This move supports the greenback and should cap the upside for the XAU/USD pair.
That said, despite the combination of supportive factors, rising geopolitical tensions continue to lend support to the dollar-denominated commodity, and any further escalation of the conflicts in the Middle East would help raise gold prices.
As we advance, investors look forward to the U.S. docket featuring the release of the JOLTs Job Openings (Dec) and the CB Consumer Confidence (Jan) data reports. The main focus, however, remains on the January Fed interest rate decision and the Non-Farm payrolls (NFP) data set for release on Wednesday and Friday, respectively.
Technical Outlook: Four-Hour Gold Price Chart
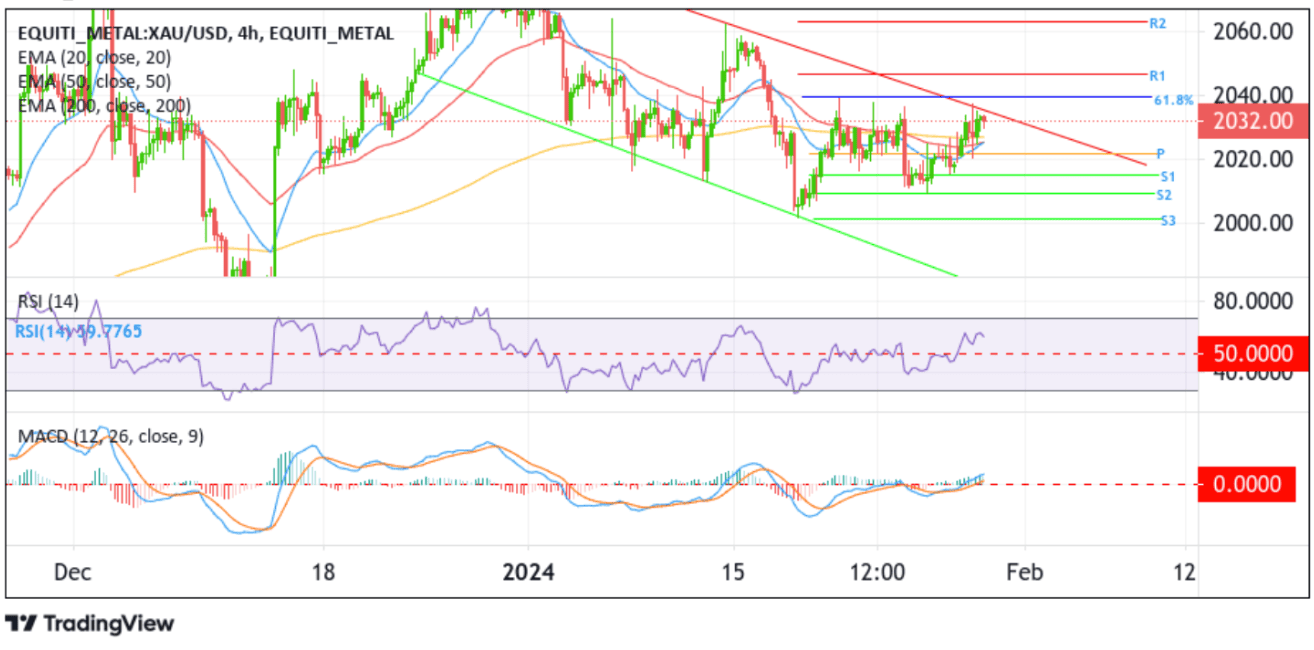
From a technical standpoint, the precious yellow metal's ability to capitalize on the rejection from the multi-week-old descending trend-channel resistance favors bearish traders. A further increase in selling momentum would drag spot prices toward the technically strong 200-day (yellow) Exponential Moving Average (EMA) at the 2027.13 level. Acceptance below this level would negate the bullish bias and pave the way for additional losses. Gold could then accelerate the fall toward the pivot level (p) at 2022.88, about which, if this level fails to hold, new sellers could join in, paving the way for a decline toward the 2015.31 support level (S1). A clean move below this level would pave the way for a further drop toward the 2009.37 level (S2), followed by the 2001.50 level (S3), and in highly bearish cases, the metal could extend a leg down toward the multi-week-old descending trend-channel support.
On the flip side, if buyers resurface and spark a bullish turnaround, initial resistance comes in at the upper-descending channel. A subsequent break above this channel will pave the way for an ascent toward the 61.8% Fibonacci retracement level of the 12th January - 17th January downfall. A convincing move above this level would reaffirm the bullish bias and set the stage for further long-term appreciating moves. Gold could then rally toward the 2046.61 level (R1), which, if cleared decisively, would pave the way for a move toward the 2062.43 ceiling.