NZD/USD Clings To Upbeat N.Z. Trade Balance Data And Moves Back Above 0.60900 Levels


Key Takeaways:
- NZD/USD cross bounced sharply on Monday during the Asian session and moved back above 0.60900 levels
- Upbeat New Zealand Trade Balance data acts as a tailwind for the Kiwi
- Despite the supportive factors, the fundamental backdrop seems tilted firmly in favor of USD bears
NZD/USD cross attracted some sharp buying on Monday during the early Asian session and bounced off from nearly a five-week low/0.60868 level. At the time of speaking, the pair is up over 7 pips for the day and looks set to keep its offered tone heading into the European session.
The upbeat New Zealand Trade Balance data report released earlier today could have been the catalyst for today's sharp early-Asian session bounce. Statistics New Zealand report showed that New Zealand's trade deficit narrowed to $0.323 billion in December 2023 from $0.651 billion in the corresponding month of the previous year.

Exports declined by 8.7% from a year earlier to $5.9 billion due to lower sales of milk powder, butter, and cheese (-23%), casein and caseinates (-26%) and wood pulp and waste paper (-40%). Meanwhile, imports fell by 13% to $6.3 billion, mainly aircraft and parts (-82%); vehicles, parts, and accessories (-17%); electrical machinery and equipment (-20%) and food residues, wastes, and fodder (-55%).
Market expectations that the RBNZ will push back rate cuts to mid-year are further underpinning the Kiwi and helping exert upward pressure on the NZD/USD pair. This comes after a Statistics New Zealand report released last week showed the annual inflation rate in New Zealand eased to 4.7% in the three months to December 2023 from 5.6% in the third quarter but remained well above the Reserve Bank of New Zealand's (RBNZ) target of 1% to 3%.
Despite the combination of supportive factors, the fundamental backdrop seems tilted firmly in favor of USD bears. This comes amid reduced market bets on the Fed's aggressive early rate cuts.
Markets seem convinced that the Fed will leave rates unchanged during the March meeting and start cutting rates during the third quarter of 2024 after several influential FOMC members over the past few weeks voiced their concerns about early rate cuts, warning that despite progress made in tackling inflation, markets have gotten ahead of themselves in terms of expectations for spring rate cuts.

Moreover, a fresh round of positive U.S. macro data released last Friday reaffirmed market expectations that the Federal Reserve might prolong its hawkish stance into the second quarter, helping push back the idea of early rate cuts.
A U.S. Bureau of Economic Analysis report released last Friday showed that core PCE prices in the U.S., excluding food and energy, rose by 0.2% from the previous month in December o023, aligned with market estimates and slightly from the 0.1% increase in November. From last year, core PCE prices edged 2.9% higher, undershooting market estimates of 3% to mark the lowest reading since February 2021.
The upbeat U.S. core PCE data and this month's positive U.S. macro data cement market expectations that the Federal Reserve will cut rates by the middle of 2024. This move supports the greenback and should cap the upside for the NZD/USD pair.
As we advance, without any significant market-moving economic news data, the Treasury bond yields and the general market risk sentiment will continue to influence U.S. dollar dynamics and ultimately provide directional impetus to the NZD/USD cross.
Technical Outlook: Four-Hour NZD/USD Price Chart
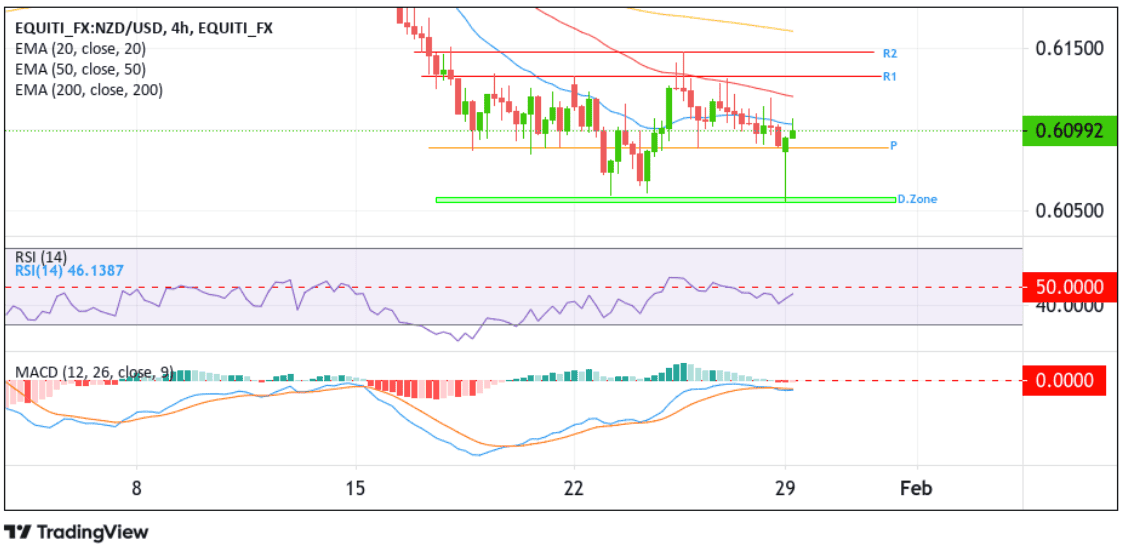
From a technical standstill, the NZD/USD pair is currently placed firmly above the 0.60900 level following an earlier sharp bounce from the 0.60603 - 0.60554 demand zone and a convincing break above the 0.60887 pivot level (P). A further increase in buying pressure from the current price level will uplift spot prices to tag the 50-day (red) Exponential Moving Average (EMA) level at 0.61193. Some follow-through buying would see the shared currency ascend further to retest the 0.61316 level (R1). A clean move above this level would pave the way for a move toward the 0.61477 ceiling (R2), about which, if the price pierces this barrier, buying interest could gain further momentum, paving the way for a move toward the technically strong 200-day (yellow) EMA level at 0.61586.
It is worth noting that for this setup to be validated, traders should wait for confirmation from the technical oscillators. The RSI and MACD oscillators should move above their signal lines to signal the extension of the bullish momentum for the rest of this week.
On the flip side, if sellers resurface and spark a bearish turnaround, initial support comes in at the 0.60887 level. If sellers manage to breach this floor, downside pressure could accelerate, paving the way for a drop toward the 0.60603 - 0.60554 demand zone. Sustained weakness below this zone would reaffirm the bearish bias and pave the way for dip losses around the shared currency.