Gold Rebounds Modestly From Four-Month Low Amid Extreme Oversold Conditions, and Further Uptick Seems Elusive


Key Takeaways:
- Gold rebounds modestly from a four-month low on Friday during the Asian session, but a further uptick seems elusive
- Fed's Minutes signal more rate hikes ahead, supporting rising treasury bond yields and helping cap the upside for the XAU/USD cross
- Gold might extend the modest pullback if incoming data comes in weaker than the market consensus
Gold futures edged slightly higher on Thursday during the Asian session following a modest rebound from the vicinity of the 1889.622 level touched in the last hour or so. As per press time, the precious yellow metal is trading in modest gains above $1892.400 an ounce, but a further uptick seems elusive amid the prevalent U.S. dollar buying.
Rising bets for one more 25 basis points (bps) rate hike by the Federal Reserve (Fed) in September or November support rising Treasury Bond yields, underpin the greenback and help exert downward pressure on gold prices. The bets were cemented after August's FOMC Meeting Minutes report released on Wednesday showed Federal Reserve officials expressed concern at their most recent meeting about the pace of inflation and said more rate hikes could be necessary unless conditions change.
Noteworthy discussions during a two-day July meeting resulted in a quarter percentage point rate hike in August that markets generally expected to be the last of this cycle. However, recent data pointing to a modest rise in inflation both at the consumer and producer levels, cooling job growth but a resilient job market, and stronger-than-expected U.S. GDP growth have to a greater extent, reversed hopes that the Fed may refrain from tightening monetary policy further this year. CME's Fed Watch Tool shows fed fund futures traders now pricing in almost a 14% and 36% chance that the Fed will raise interest rates by 25bps to 5.5% during the September and November FOMC Meetings, respectively.
Further weighing on gold prices is the weak demand from China, as fresh macro data from China continues to point to a subdued recovery in the wake of its fight against Covid-19. A National Statistics Bureau of China report on Tuesday showed. China's industrial production increased 3.7% year-on-year in July 2023, slowing from a 4.4% rise in June and below forecasts of 4.4% due to softer rises in manufacturing activity (3.9% vs 4.8%) and mining output (1.3% vs 1.5%). Additionally, China's retail sales increased by 2.5% year-on-year in July 2023, slowing from a 3.1% growth in the prior month and missing market estimates of 4.5%.
Fear that the Fed rate hike could lead the economy into a mild recession tempered investors' appetite for risk-perceived assets. This was evident from a generally weaker tone around the equity markets, which continues to drive some haven flows toward the XAU/USD pair. Additionally, investors have closed their winning positions amid extreme oversold conditions. Apart from this, the greenback continues to be supported by a fresh round of positive macro data, which showed Housing starts in the US rose by 3.9% month-over-month to a seasonally adjusted annualized rate of 1.452 million in July 2023, above market expectations of 1.448 million a U.S. Census Bureau report showed. To a greater extent, the upbeat Housing Starts report overshadowed a decline in Building permits issued and industrial production last month.
As we advance, investors look forward to releasing the U.S. Philadelphia Fed Manufacturing Index (Aug) and the Initial Jobless Claims report for last week for fresh directional impetus.
Technical Outlook: Four-Hours Gold Price Chart
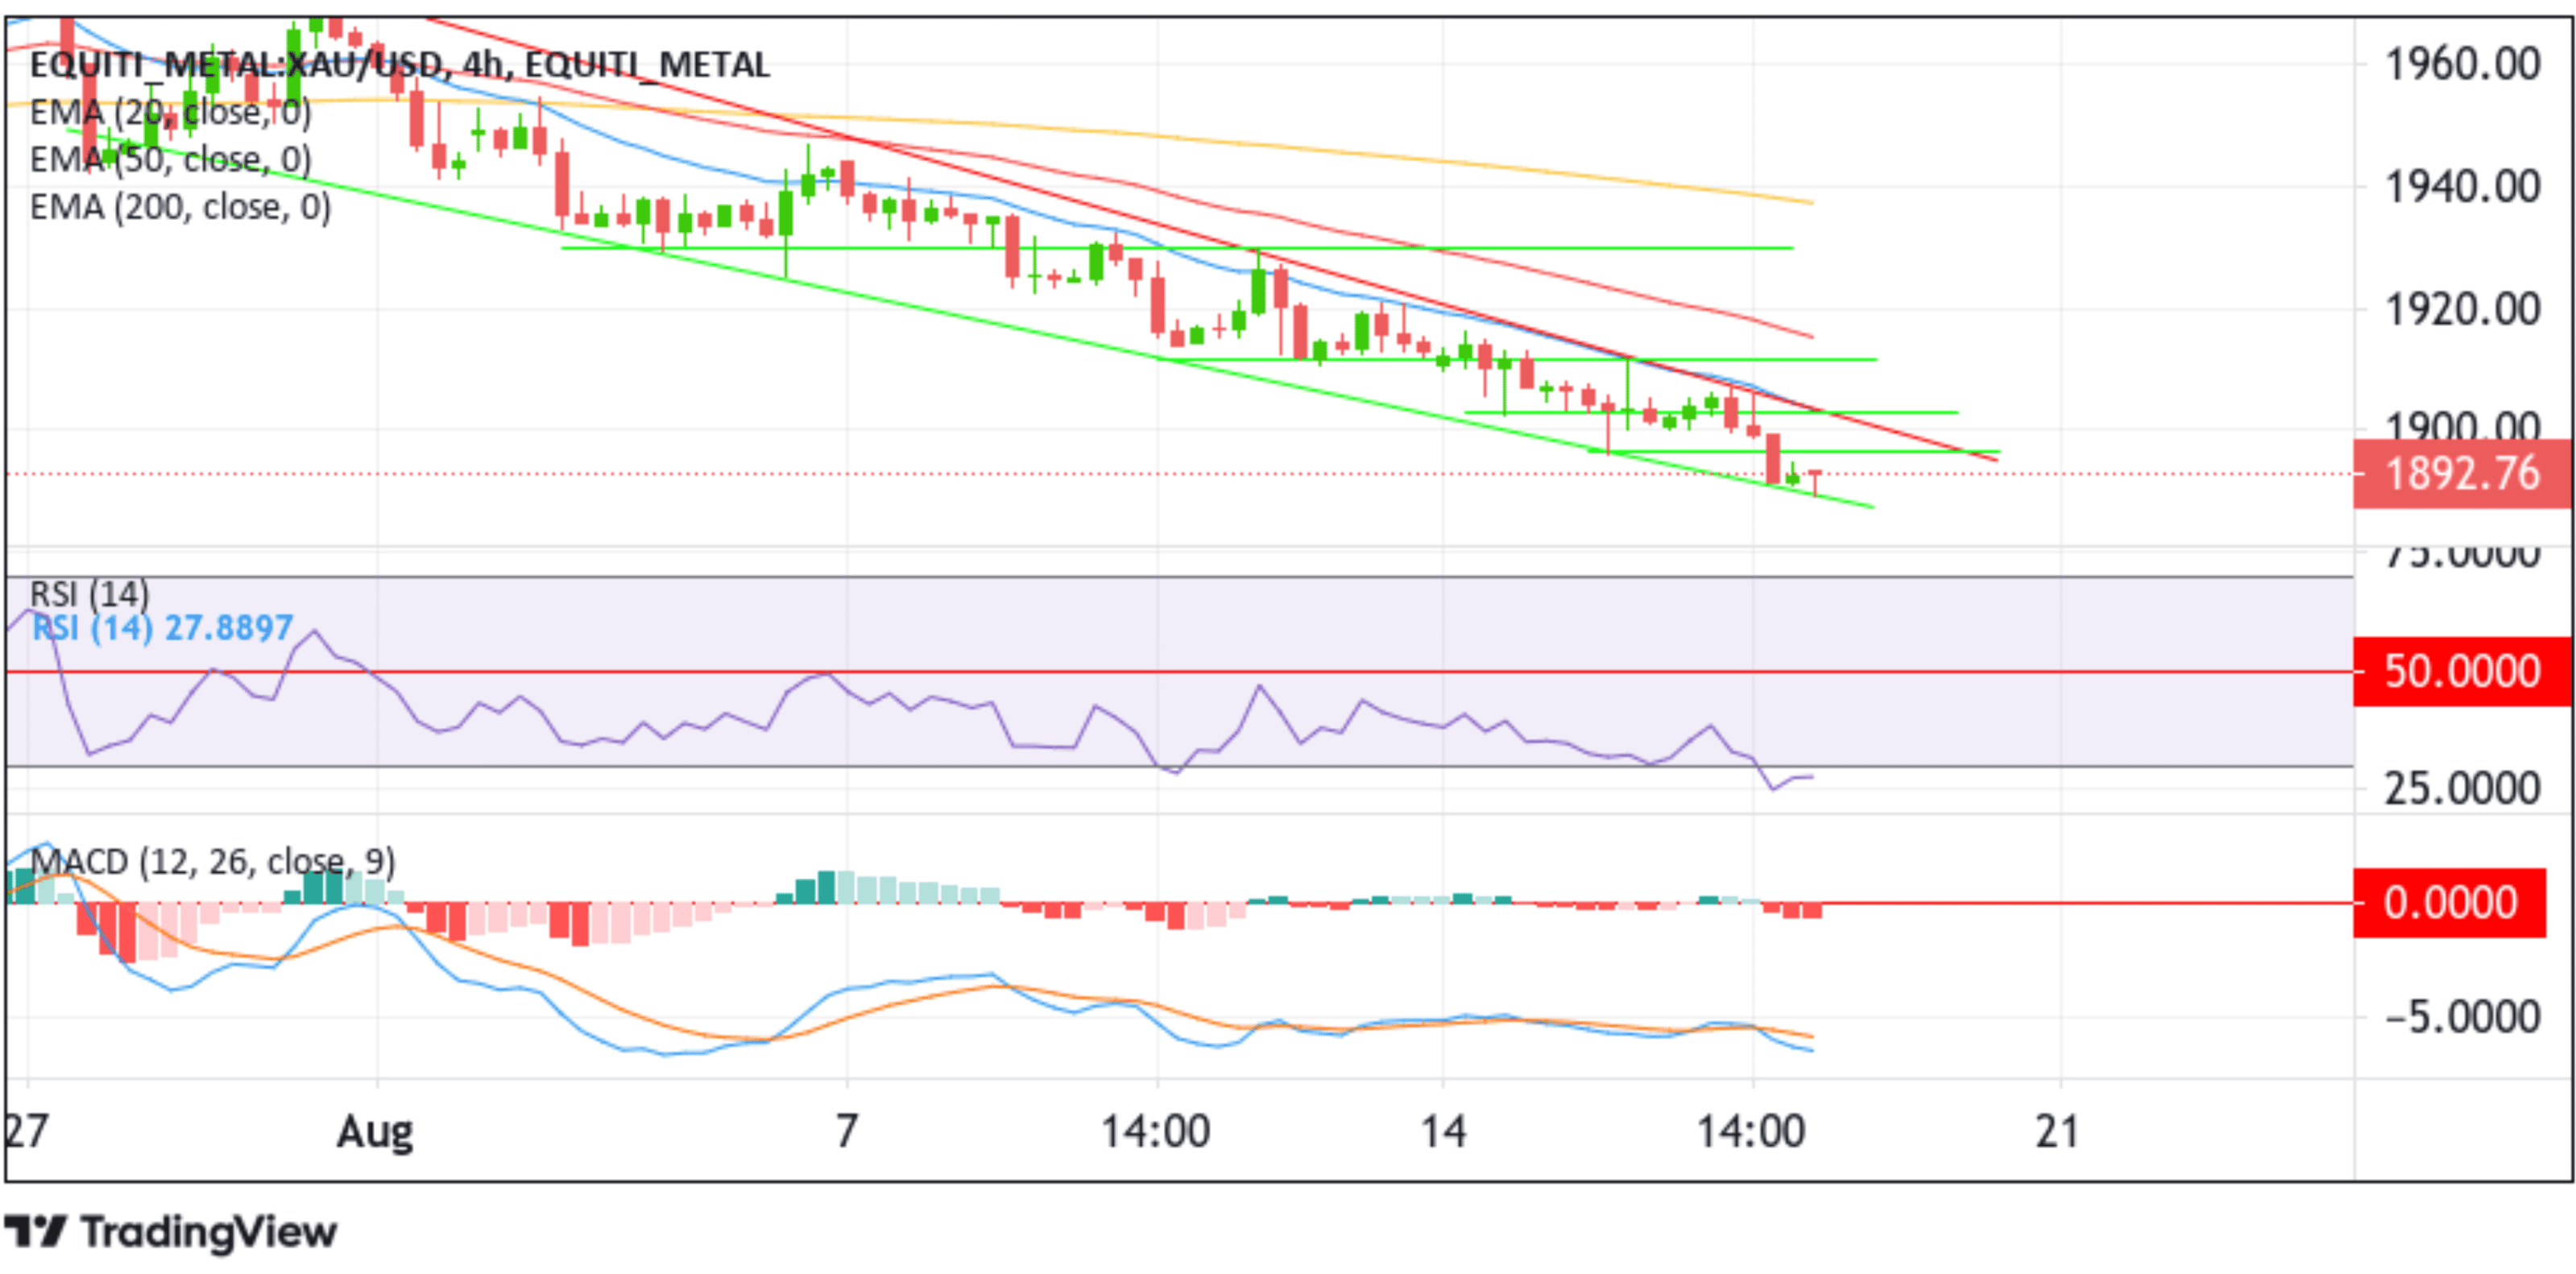
From a technical perspective, a further increase in buying pressure from the current price level will face initial resistance at the 1896.22 resistance level. If the price pierces this barrier, the price could ascend further toward the upper limit of the descending channel pattern. A subsequent break (bullish price breakout) above this resistance level would pave the way for an extension of the bullish uptick toward tagging the 50-day (red) EMA level at the $1915.39 level. Further north, the price could rally toward the $1929.76 horizontal level, about which, if the price clears this barrier decisively, attention will shift toward the technically strong 200-day (yellow) EMA level. A convincing move above this barrier would negate any near-term bearish outlook and pave the way for aggressive technical buying.
All technical indicators point to strong bearish momentum, and the recent pullback could be short-lived. That RSI (14) level at 27.8897 flashes strongly oversold conditions and warrants caution for traders against submitting aggressive bearish bets. The Moving Average Convergence Divergence (MACD) crossover at -0.005966 adds credence to the bearish filter.
On the flip side, if sellers resurface and spark a bearish turnaround, initial support appears at the lower limit of the descending channel pattern extending from the early-August 2023 swing low. A subsequent break below this support level would reaffirm the bearish thesis and pave the way for further losses around the XAU/USD cross.