Gold Rebounds From $1966.098 Level Following A Minor PullBack, Further Uptick Seems Possible


- Gold witnessed some buying during the early Asian session and extended the sharp rebound from the previous day's low
- The banking sector crisis over the past week spurred heavy flows toward the precious metal, in turn, saw gold prices rally to a record high of $2009.59
- Expectations of a less hawkish fed continue to offer support to the precious yellow metal as markets price in a 25bps during Wednesday's meeting

XAU/USD cross extended the sharp rebound from the previous day's low/ $1966.098 level and gained positive traction on Tuesday. The momentum lifted spot prices above $1980 per ounce during the early Asian session. It regained some losses after gold prices retreated from their highest level in a year in volatile trading on Monday. Share markets and Treasury yields bounced back on central banks' efforts to restore confidence in the financial sector.
The Precious Yellow metal rose on Monday by 1% during the early European session to reach its highest level since March 2022 at $2009.59, just shy of a record set during the onset of the COVID-19 pandemic.
Supporting the Gold rally for the past week was the contagion resulting from the banking crisis that saw two regional banks, the US-Silicon Valley Bank and Signature bank, collapse, followed by a downturn in Credit Suisse after the Saudi National Bank ruled out offering assistance to the troubled bank. As a result, the treasury bond yields fell last week to their lowest levels in a year as traders fled to safe-haven assets, benefitting gold and weighing down on the U.S. Dollar.
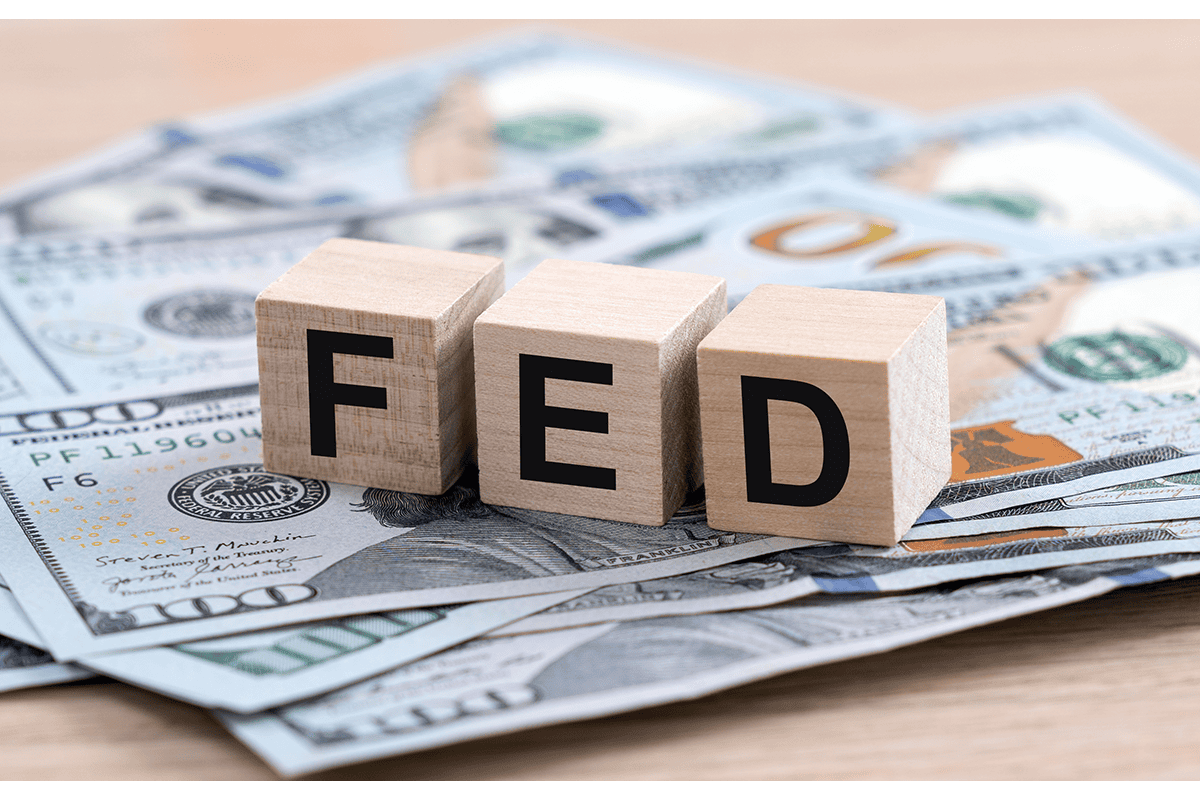
Additionally, growing acceptance that the F.E.D. will adopt a less hawkish stance in its monetary policy meeting later this week is another factor undermining the greenback and driving flows toward the yellow metal. In the wake of last week's Banking crisis, markets are now pricing a greater chance of smaller 25bps lift-off. That said, the probability of a 25 bps interest rate hike has increased to 34.3%, up from 32.8% last week, as seen in C.M.E.'s Fedwatch Tool.
That said, the U.S. Central Bank is yet to be seen if it will raise interest rates as per the market expectations on Wednesday especially considering U.S. inflation is still trending well above the Fed's target range. However, a more significant increase is unlikely following last week's banking crisis. Many on Wall Street blame that on the central bank's rate increases instead of what appears to be reckless risk-taking by the executives of the banks that went under. There is pressure now on the Fed not to raise any rate. The central bank's chair Jerome Powell has yet to sign that he will not capitulate to such demands.
As we advance, The next test of Gold's bullishness may come Wednesday, perhaps not from the rate decision itself but what Powell and his colleague say on the path forward. A hawkish stance by Powell and his colleagues will see gold weaken, while a dovish stance preceded by a 25bps will see gold prices rally toward the $2000 resistance level.
Technical Outlook: Four-Hour XAU/USD Price Chart
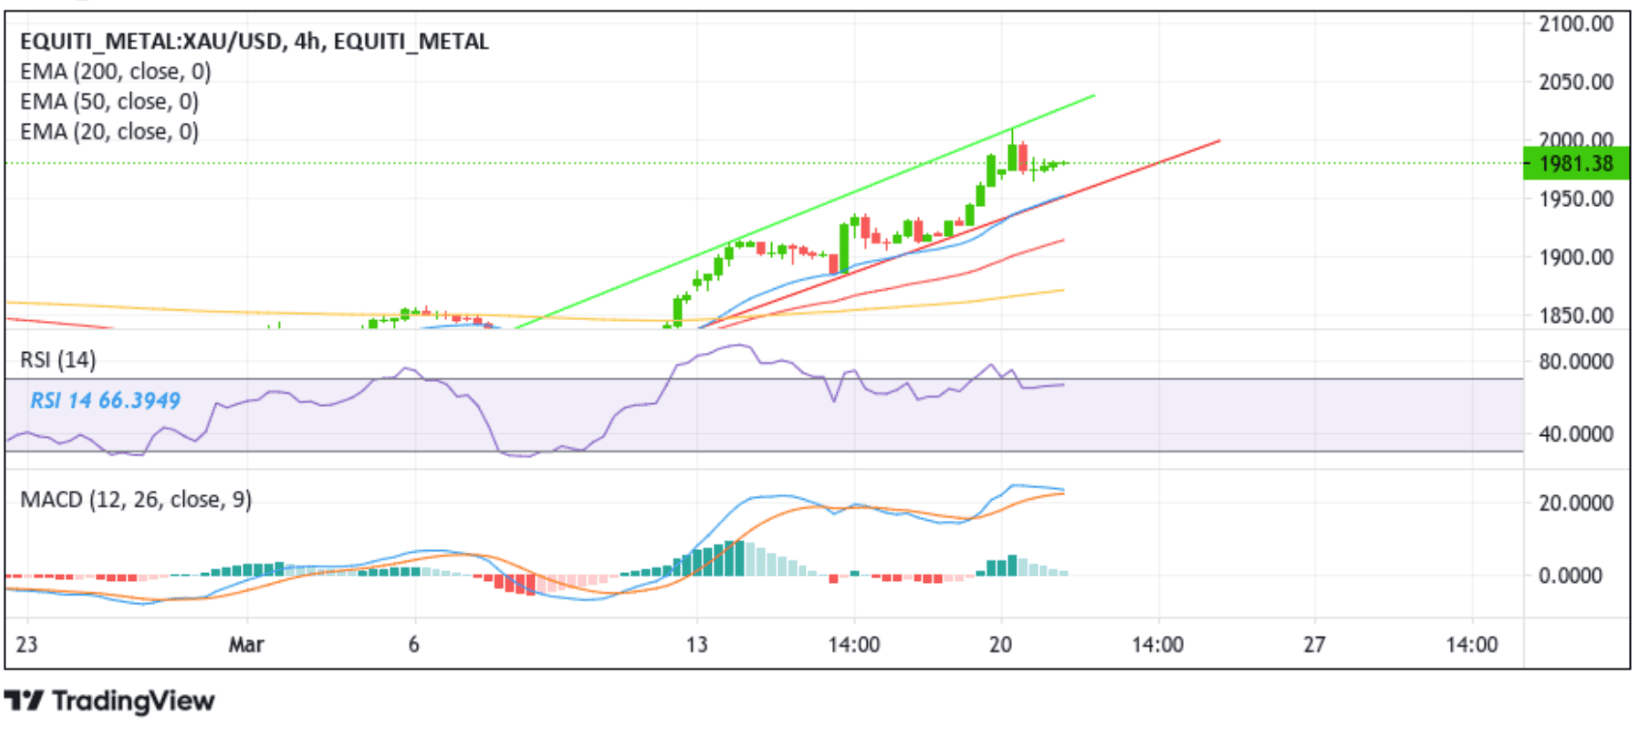
From a technical standstill, gold prices extended the sharp rebound from the vicinity of $1966.098 level after a modest pullback from the vicinity of $2009.59. Some follow-through buying would uplift gold prices toward the $2000.00 resistance level. If buyers manage to break above this ceiling, gold prices could extend the upward momentum towards this month's high at the $2009.59 level, which might act as a barrier against further uptick. However, sustained strength above this level would pave the way for an ascent toward the key resistance level plotted by an ascending trendline of an ascending channel pattern extending from the mid-March swing high.
All of the technical oscillators on the chart are in dip bullish territory, with both the R.S.I. (14) at 66.3949 and the M.A.C.D. crossover sitting above their signal lines, indicating a bullish sign of price action this week. The bullish bias is further supported by the acceptance of the price above the technically strong 200 (yellow) E.M.A. level at $1873.778. Additionally, the 50 and 2000 E.M.A. crossover (Golden Cross) at the $1850.890 level adds credence to the bullish bias.
On the flip side, if dip-sellers and tactical traders jump back in and trigger a bearish reversal, the price will first find support at the $1973.697 level. On further weakness, the focus shifts lower towards the $1960.277 support level. A break below this level would pave the way for a drop toward the key support level plotted by an ascending trendline of an ascending channel pattern extending from the mid-March swing low.
Sustained weakness below this support level would pave the way for additional losses around gold prices.