XAU/USD Stalls Near Multi-Month Peak On Soft U.S. Dollar


- XAU/USD flat-lined on Thursday during the mid-Asian session and remains stalled Near three Months High
- A Soft U.S. Dollar amid retreating treasury bond yields drives flows away toward the Precious Yellow Metal
- Rising COVID-19 cases in China act as a headwind for the safe-haven greenback and offer some support to the Non-yielding bullion
- Upbeat Retails sales data fail to cheer up the XAU/USD bears amid the growing likelihood of slowing down further rates increases

Gold Prices were flat-lined on Thursday during the mid-Asian session and remained pinned near three month high as the mixed signals from top Fed officials suppressed the U.S. dollar and pinned it to recent lows. Low demand for the U.S. Dollar amid retreating treasury bond yields saw gold prices rally from the beginning of this month to nearly three months high. Rising COVID-19 cases in major importer China pointed to more potential demand disruption. On Tuesday, China reported 17,772 new local COVID-19 infections for Nov.14, up from 16,072 a day earlier and the most since April, even as many cities scaled back routine testing after authorities announced measures last week aimed at easing the impact of heavy coronavirus curbs.

That said, a slew of U.S. economic data suggested that inflation could be slowing in the U.S. Both the CPI and PPI inflation data for October all came below market expectations adding further pressure on the FED to slow down from increasing its fed funds rate further. In fact, following the two inflation data reports, CME's Fed watch tool is now pricing in an 80.6% probability of the FED raising its interest rates by 25-50bps in its December Monetary Policy Meeting. Commenting on the CPI data report, Fed officials Lael Brainard and Christopher Waller said this week that the U.S. central bank is likely to hike rates slower in the coming months. But they also suggested that the bank's hiking cycle was far from over and that stubbornly high inflation warranted much more tightening. This, in turn, was interpreted as a mixed signal by the FED and acted as a headwind for the greenback.

That said, Data on Wednesday showed Retail sales in the U.S. surged 1.3% month-over-month in October of 2022, the strongest increase in eight months, after a flat reading in September and beating market forecasts of a 1% gain according to a report by the U.S. Department of Commerce. "This is not what the Fed wants to see, but it comes at a time when inflation numbers are starting to improve," said Eugenio Aleman, chief economist at Raymond James in St. Petersburg, Florida. "This will keep the Fed on guard and committed to continue to increase interest rates in order to slow down economic activity."

Also, Fed Governor Christopher Waller, an early and outspoken "hawk," added on Wednesday that the Fed has a ways to go on rates and will still need increases into next year, although he said that data made him "more comfortable" with the idea of slowing to a 50-basis point hike in December. San Francisco Fed President Mary Daly told CNBC it's reasonable for the Fed to raise its policy rate to a 4.75%-5.25% range by early next year and that pausing rate hikes is not part of the discussion.
Going forward, Rising U.S. interest rates weighed heavily on the Gold markets this year, as higher yields on Treasuries ramped up the opportunity cost of holding non-yielding assets. But while Gold is still off substantially from its annual highs, the metal is now close to breaking even for the year. Recent gains saw the yellow metal sharply pare its year-to-date losses to about 3%.

Technical Outlook: XAU/USD Four-Hour Price Chart

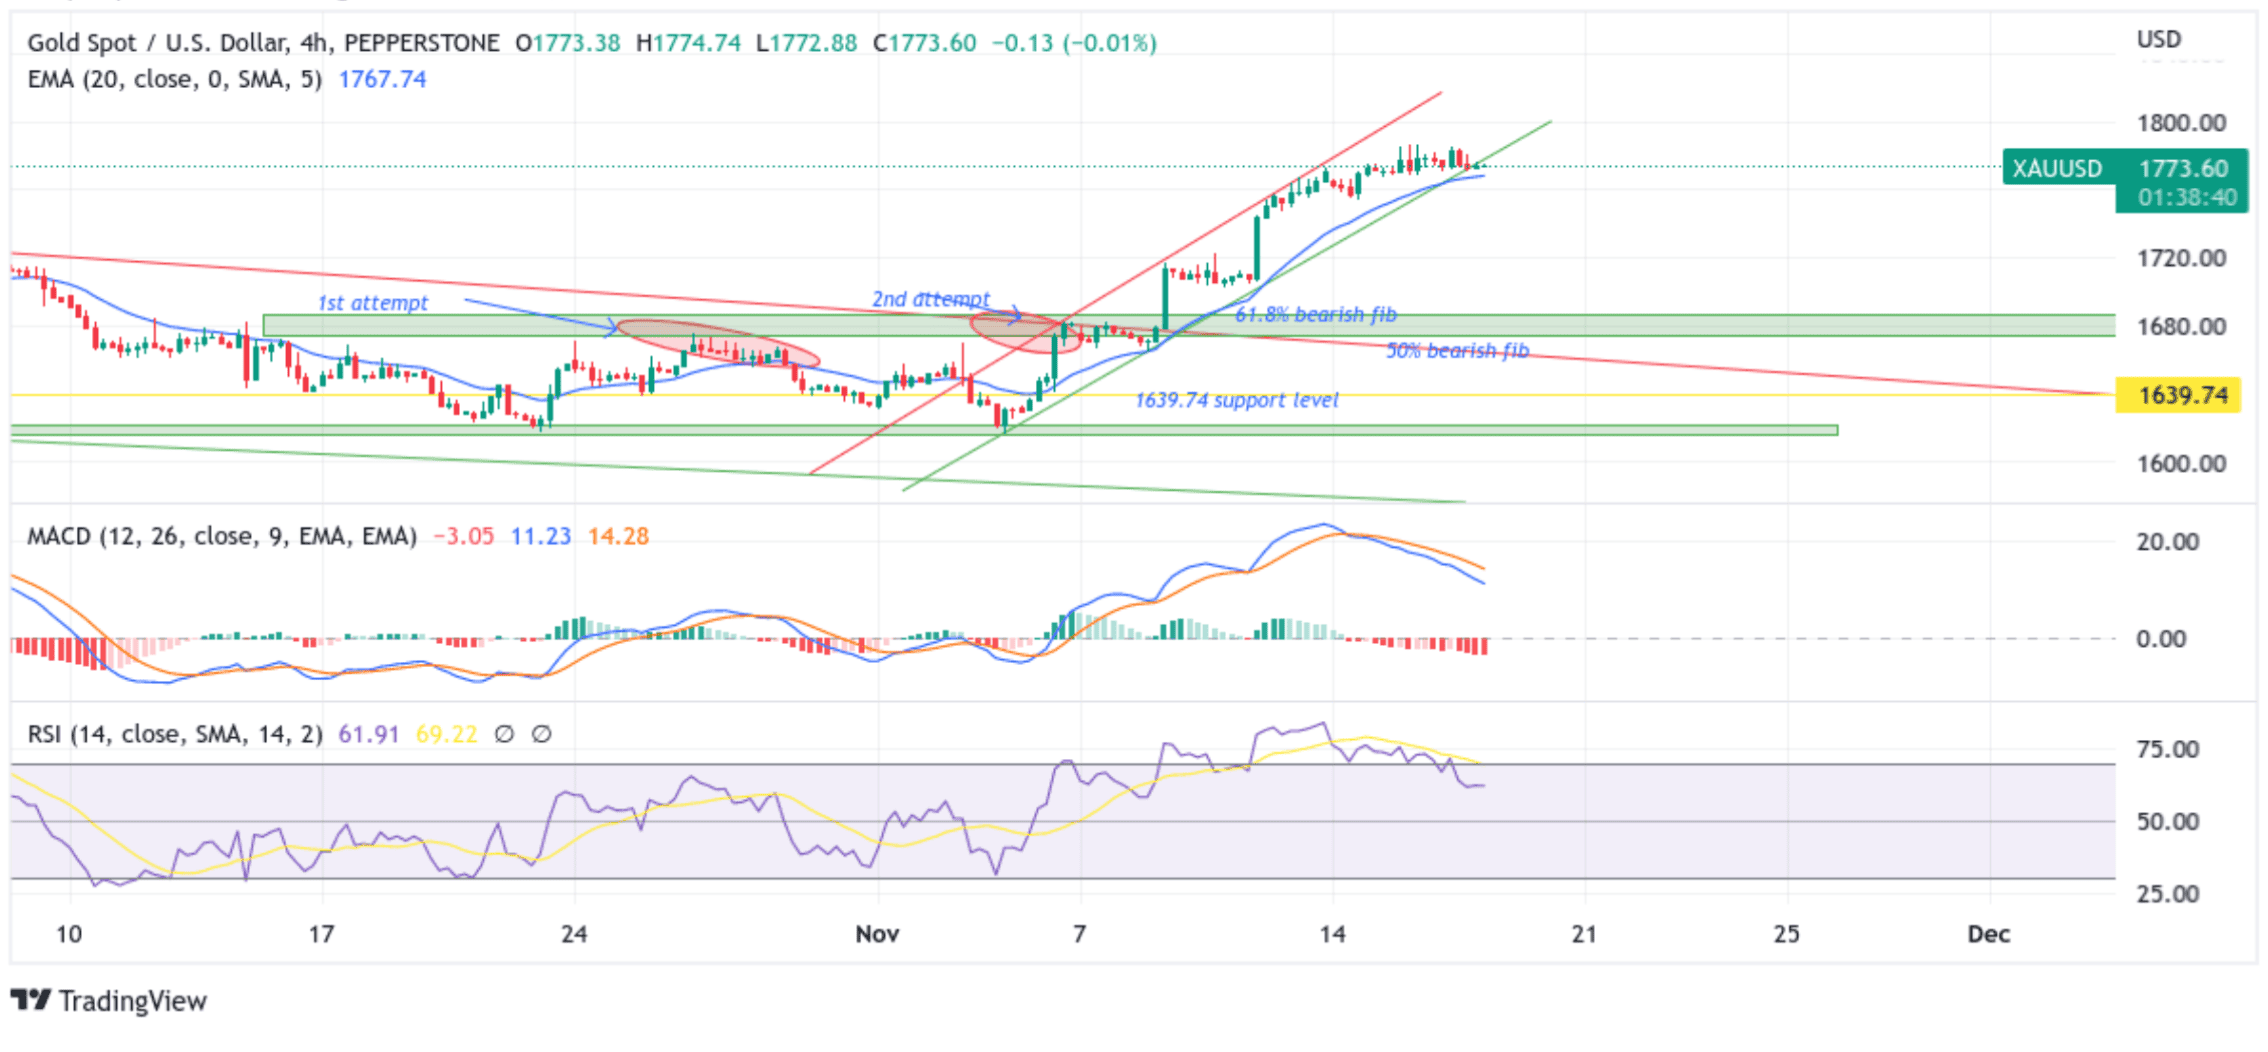
From a technical perspective using a four-hour price chart, the price is flat-lined at the 1773.60 level after confirming a fresh bearish breakout from the lower trendline of the ascending channel pattern plotted from the 3rd November swing low. If buyers manage to regain back momentum and push up the price convincingly, breaking above the aforementioned trendline now turned resistance level, the attention will shift toward the 1785.15 resistance level. Sustained strength above the aforementioned resistance level would pave the way for aggressive technical buying around the XAU/USD pair.
All the technical oscillators are in positive territory, with the moving average convergence divergence (MACD) above the signal line pointing to a bullish sign of price action this week. On the other hand, The RSI(14) level at 61.91 is displaying a shift change from flashing overbought conditions.
On the flip side, if sellers and technical traders jump in and spark a bearish turnaround, initial resistance will be at the 1767.31 level( 20EMA). If sellers manage to breach this floor, the attention will shift downwards toward the key Demand zone ranging from 1751.66 - 1759.14 levels. That said, a convincing break below the aforementioned Demand zone would negate any near-term bullish outlook and pave the way for further losses around the pair.

