XAU/USD Struggles To Find Acceptance Above 1654.00 Mark Amid Modest USD Rebound


- Gold attracts Fresh selling on Wednesday amid modest USD rebounds
- Expectations for a more aggressive policy tightening by the Fed offer some support to the greenback and exert downward pressure on the pair
- China's signal not to scale back its zero-COVID policy infuses adrenaline pressure on the USD bears

XAU/USD pair came under renewed selling pressure on Wednesday after attracting bearish bets during the late hours of the Asian session to drag spot prices lower from the vicinity of the 1654.495 level/daily high. At the time of speaking, the pair is down over 30 pips for the day and looks set to maintain its offered tone going forward to the European session amid some us dollar dip buying which is seen as a key factor weighing on the dollar-denominated commodity.
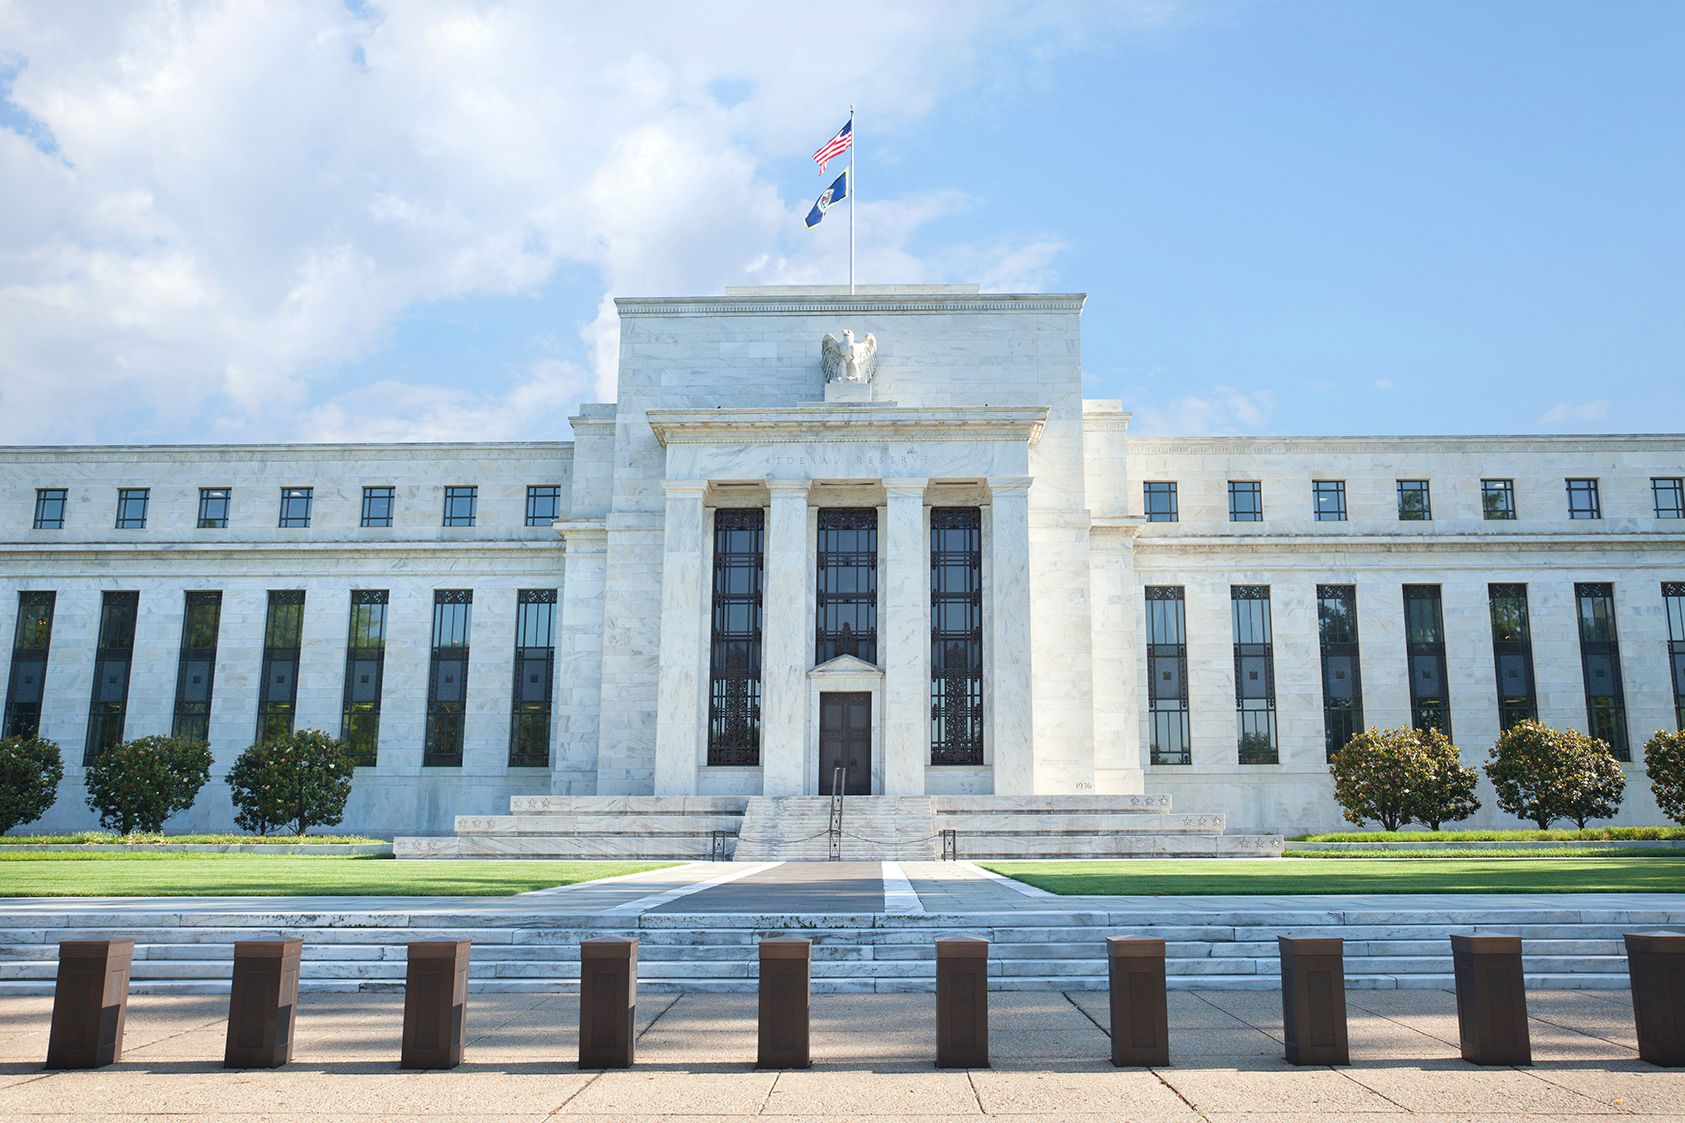
Expectations for a more aggressive policy tightening by the Federal Reserve assist the U.S. dollar in attracting some dip-buying and offers some support to the dollar-denominated commodity. That said, the risk-on impulse and a softer tone surrounding the U.S. Treasury bond yields benefitted the safe-haven buck. Additionally, the hotter-than-expected inflation data released last week reaffirmed bets of aggressive rate hiking by the fed. This was a crucial factor that triggered a fresh leg up in the U.S. treasury bond yields. Following the inflation data report, CME's FED watch tool is now pricing a 95.9% probability of a 75bps -100bps rate hike during FED's next monetary policy meeting on 2nd November. A series of hawkish comments from Top US FED officials could also be linked to the XAU/USD pair's latest struggle to keep buyers on board. Minneapolis Fed President Neel Kashkari said the Fed might push its benchmark rate above 4.75% if underlying inflation does not cool.
Additionally, Atlanta Fed President Raphael Bostic also stressed the need to bring inflation under control, citing pressure on the labor market from rising rates and prices. Further lifting the U.S. Dollar was the Upbeat industrial production data which showed an increase in the U.S. industrial production to land at 105.18, up from 104.78 last month and up 99.85 one year ago. This is a change of 0.38% from last month and 5.33% from one year ago.

Additionally, China's signal that it will not scale back its zero-COVID policy was also seen as another source of selling pressure on the yellow metal, as were growing fears of a U.S. recession. Lockdowns to combat COVID outbreaks are at the heart of China's economic woes this year. Market participants now look forward to the U.S. economic docket featuring the release of the U.S. Building report and the Housing Starts report for September. Investors will further look for cues from the speech of Minneapolis FED President Neel Kashkari on future monetary policy decisions by the FED. His speech and the U.S. bond yields will influence the USD price dynamics and provide some impetus to gold. Apart from this, traders will take cues from the broader market risk sentiment to grab short-term opportunities around the XAU/USD Pair.
Technical Outlook: XAU/USD Four-Hour Price Chart
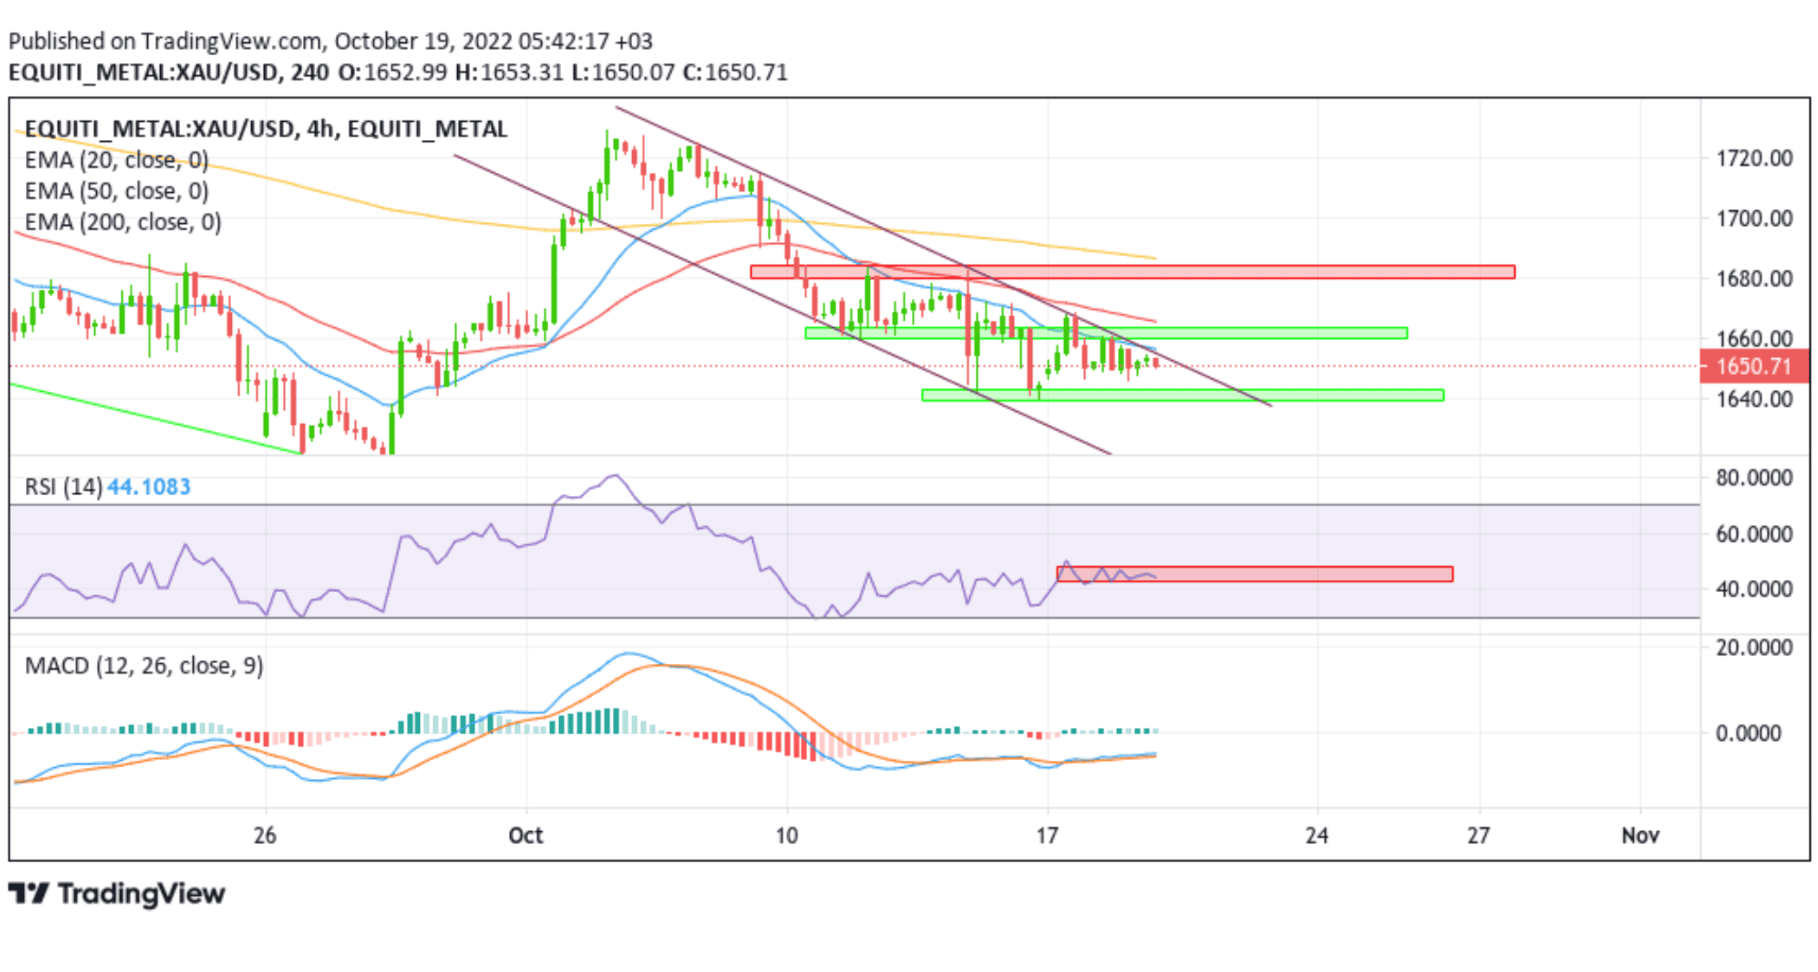
From a technical perspective, using a four-hour price chart, gold prices rebounded from the vicinity of the 1653.26 level after sensing a strong resistance level plotted from the 6th October 2022 swing high. Some follow-through selling would drag spot prices toward the demand zone ranging from 1639.41- 1642.94 levels. A convincing break below the aforementioned support level would be seen as a fresh by bears to continue to push down the price. The downward trajectory could then accelerate toward testing the 1615.916 support level, which coincides with a lower trendline of the descending channel pattern plotted from the 10th October swing low.
All the technical oscillators are in negative territory. That said, the Relative Strength Index(RSI) has displayed a range shift after turning into a bearish range of 42.00 -44.00 from the previous 50.00-46.00 range. The impending Moving Average Convergence Divergence (MACD) crossover is moving below the signal line, pointing to a bearish sign for price action this week. Additionally, The 50 and 200 Exponential Moving Average(EMA) crossover(Golden cross) at the 1686.56 level adds credence to the downside bias.
On the flip side, any meaningful pullback now seems to find some resistance at the upper trendline of the descending channel pattern plotted from the 6th October 2022 swing high. That said, if buyers manage to pierce this ceiling, it would negate any near-term bearish outlook and pave the way for technical buying. The attention would now turn toward the supply zone ranging from 1660.03 - 1663.86 levels. A convincing break above the aforementioned zone would pave the way for aggressive technical buying.