XAU/USD Edges Higher To Extend Sharp Rebound From Weekly Low Amid Declining Treasury Yields


- Gold attracted some buying on Thursday to extend the sharp rebound from the weekly low touched on Thursday
- The uncertainty over the global economic outlook, along with mounting worries about a recession in the U.S., saw the two-year benchmark Treasury bond yields decline considerably
- U.S. Pending Home Sales Sinks 4%
- Gold has so far risen around $200 more from the two-year low hit in September

The XAU/USD cross attracted some deep buying around the vicinity of the 180.39 regions during the early Asian session and extended the sharp rebound from the weekly low touched on Wednesday. The pair has so far managed to reverse part of its earlier losses and is up over 40 pips for the day amid sustained USD weakness.
The uncertainty over the global economic outlook, along with mounting worries about a recession in the U.S. saw the two-year Treasury yield, which typically moves in step with interest rate expectations, slip overnight. This forced the U.S. dollar to trim most of its intraday gains and retreat from the weekly high touched early on Wednesday. Apart from this, signs of stability in the U.S. financial markets were also seen as another factor that offered some support to the dollar-denominated commodity.
The U.S. Dollar index (DXY), which measures the value of USD against a basket of currencies, was down 0.22% at 104.0039 as per press time (06:00 UTC+3) after steading earlier during the early hours of the Asian session.
Weighing down on the greenback was the downbeat U.S. Pending Home Sales data which showed Contracts to buy U.S. previously-owned homes fell far more than expected in November, largely due to the Fed’s interest rate hikes to curb inflation. Pending home sales in the U.S. declined 4% month-over-month in November of 2022, a sixth consecutive monthly decline and much worse than market forecasts of a 0.8% drop, as interest rates climbed, drastically cutting into the number of contract signings to buy a home. That pushed the Pending Home Sales Index to 73.9, the lowest reading since 2001, excluding the drop in the early months of the pandemic.
Despite the downbeat macro data, many investors had hoped for the data to signal an easing of inflationary pressures, as that would suggest that the Fed could further slow or completely pause interest rate hikes.
It is worth noting Gold has so far risen around $200 more from the two-year low hit in September on expectations that the U.S. central bank would slow its pace of interest rate hikes, increasing the appeal of the non-yielding asset.

In fact, On Tuesday, the price of Gold reached its highest point since the end of June due to the news that China was easing quarantine restrictions, which could lead to increased gold buying in the country, which is the top consumer of Gold. However, hospitals and funeral homes in the region were facing a severe burden from the rising number of COVID-19 cases.
As we advance, investors now look forward to the last U.S. major macroeconomic data featuring the release of the Initial Jobless Claims data report, which is expected to show an increase in the number of people who filed for unemployment insurance for the first time during the past week and land at 225,000 people up from 216,000 people a week earlier.
Technical Outlook: XAU/USD Four-Hour Price Chart
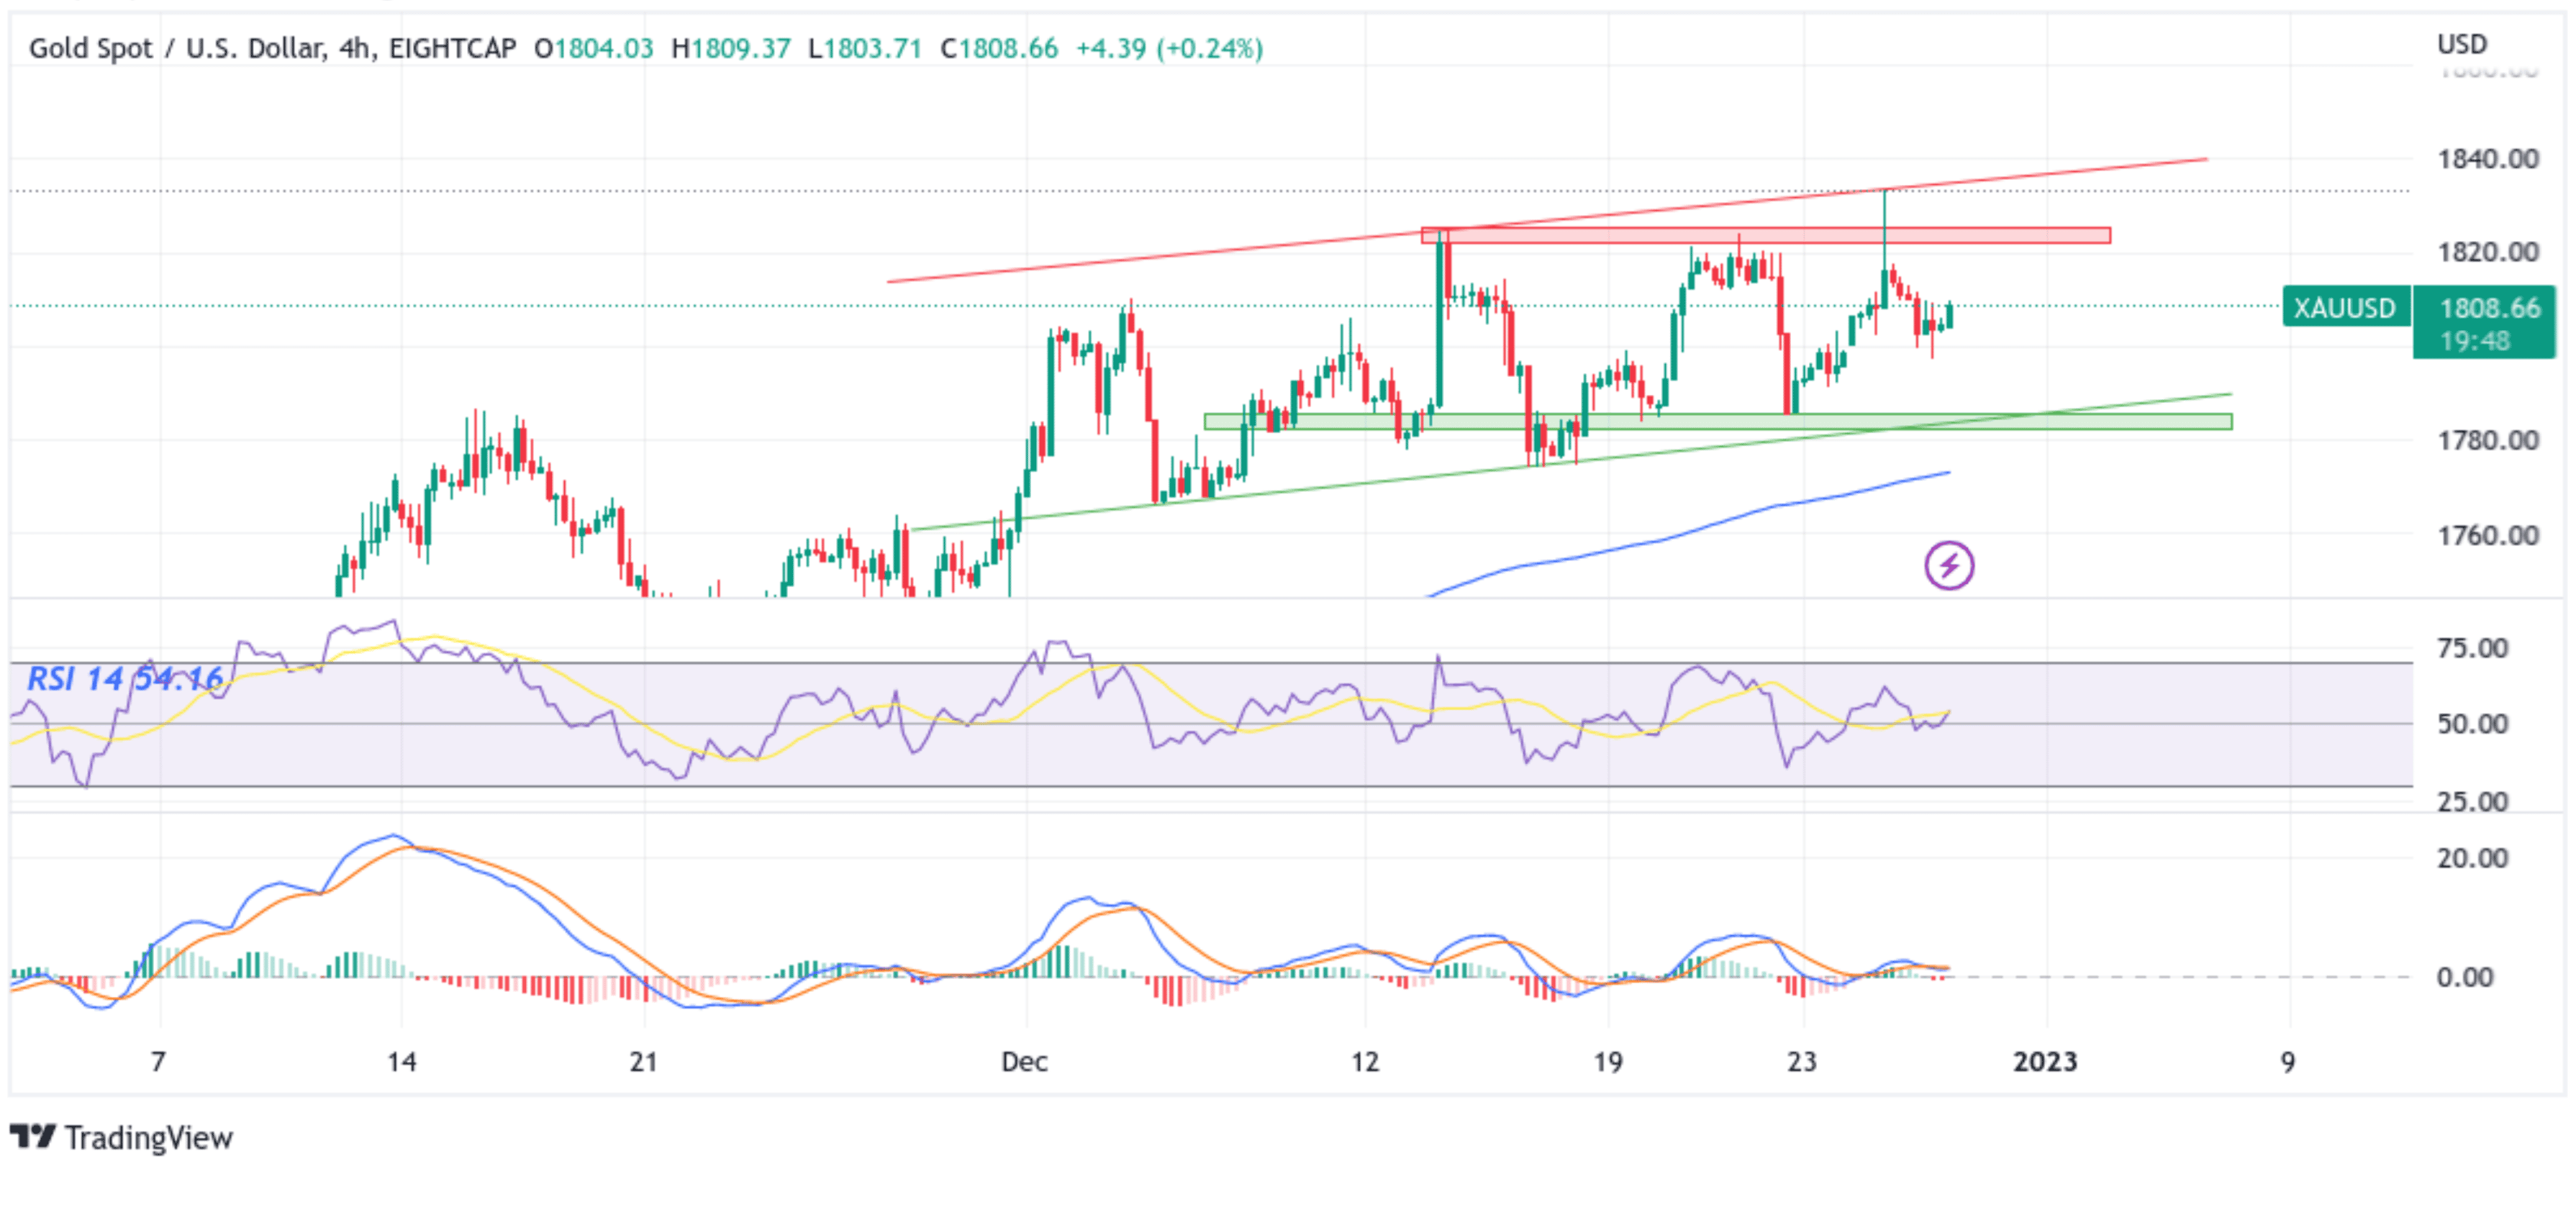
From a technical perspective, the price has extended the sharp rebound from the vicinity of the 1797.00 level. On sustained strength, spot prices would face an immediate hurdle (Key supply zone ranging from 1821.47 -1825.23) and would act as a barricade against the pair on any further uptick. However, a convincing break above this barrier would trigger bulls to continue phishing up the price. The bullish momentum could then accelerate toward retesting the key resistance level plotted by an upward trendline extending from the 13th December 2022 swing to higher highs. If price manages to pierce this barrier, it would negate any near-term bearish outlook and pave the way for aggressive technical buying.
All the technical oscillators on the chart are in positive territory, with the RSI (14) at 54.16 above the signal line adding credence to the bullish filter. On the other hand, the Moving Average Convergence Divergence (MACD) Crossover is also above the signal line, validates the upside bias, and further points to a bullish sign for price action this week.
On the Flipside, if dip-sellers and tactical traders jump in and trigger a bearish reversal, the price will find support at the 1787.13 support level en route to the key support level plotted by an upward ascending trendline extending from the 5th December 2022 swing lower-lows and also coincides with the key supply zone ranging from 1781.59 - 1785.35 levels. If sellers manage to breach these floors, it will pave the way for aggressive technical selling around the XAU/USD pair.