XAU/USD Slides Lower Below the 1786 Mark Amid Rising Treasury Bond Yields


- XAU/USD cross attracts some selling and slides below the 1786.00 mark
- Rising U.S. treasury bond yields, along with a softer risk tone, offered some support to the Greenback
- Comments from central banks suggesting that interest rates will continue to rise in the coming year have added pressure on gold
- Fears of Recession in 2023 have underpinned the Greenback and improved its appeal as the Reserve currency of the world

XAU/USD pair declined on Tuesday, remaining under bearish downward pressure, and dropped to a fresh daily low below the 1786.00 mark to extend heavy losses around the pair witnessed since Monday. The pair is trading at 1785.80, posting a 0.14% daily loss. XAU/USD stays in the negative territory amid renewed USD buying, as the risk-off market mood underpinned the safe-haven Greenback and drove flows away from the Non-Yielding bullion.
Rising US treasury bond yields, along with a softer risk tone, offered some support to the Greenback and helped to exert downward pressure on the pair as investors continued to assess the outlook for the economy and monetary policy after last week's hawkish comments from U.S. Federal Reserve. Additionally, fears of a potential recession in 2023 saw investors pivot into the dollar and Treasury yields, with the broader metal market also coming under pressure.
The U.S. Dollar index (DXY), which measures the value of the United States dollar relative to a basket of foreign currencies, traded steady against a basket of currencies this week after recovering sharply from a five-month low hit earlier. As per press time, the haven currency was trading at 104.750, up 0.07% for the day.

Gold prices have been under pressure due to a lack of bids and a shift in its haven status to the U.S. dollar. The yellow metal decreased in value in 2022 and has dropped significantly since the beginning of the conflict between Russia and Ukraine. In China, the top consumer of gold, the COVID-19 pandemic is spreading rapidly in major cities like Beijing and Shanghai. However, the Chinese government has announced plans to stabilize the economy amid the pandemic's impact.
Additionally, recent comments from central banks suggesting that interest rates will continue to rise in the coming year have added pressure to gold and other metals, as higher rates can discourage holding non-yielding assets like gold.
Investors also worry about a potential recession in 2023 due to increasing inflation and higher interest rates. The focus on slowing economic growth is also anticipated to dominate the final two weeks of trading in 2022, as there are a few other factors influencing the market. Trading activity is also expected to be lower due to market holidays.
As we advance, investors now look forward to the U.S. docket featuring the release of the Building Permits Preliminary data by the U.S. Census Bureau, which is expected to show a decrease in Housing Starts and land at 1.485, down from 1.512 M. The data report would influence the near-term USD Price dynamics. This, in turn, should assist traders in determining the next leg of a directional move for the XAU/USD pair.
Technical Outlook: XAU/USD Four-Hour Price Chart
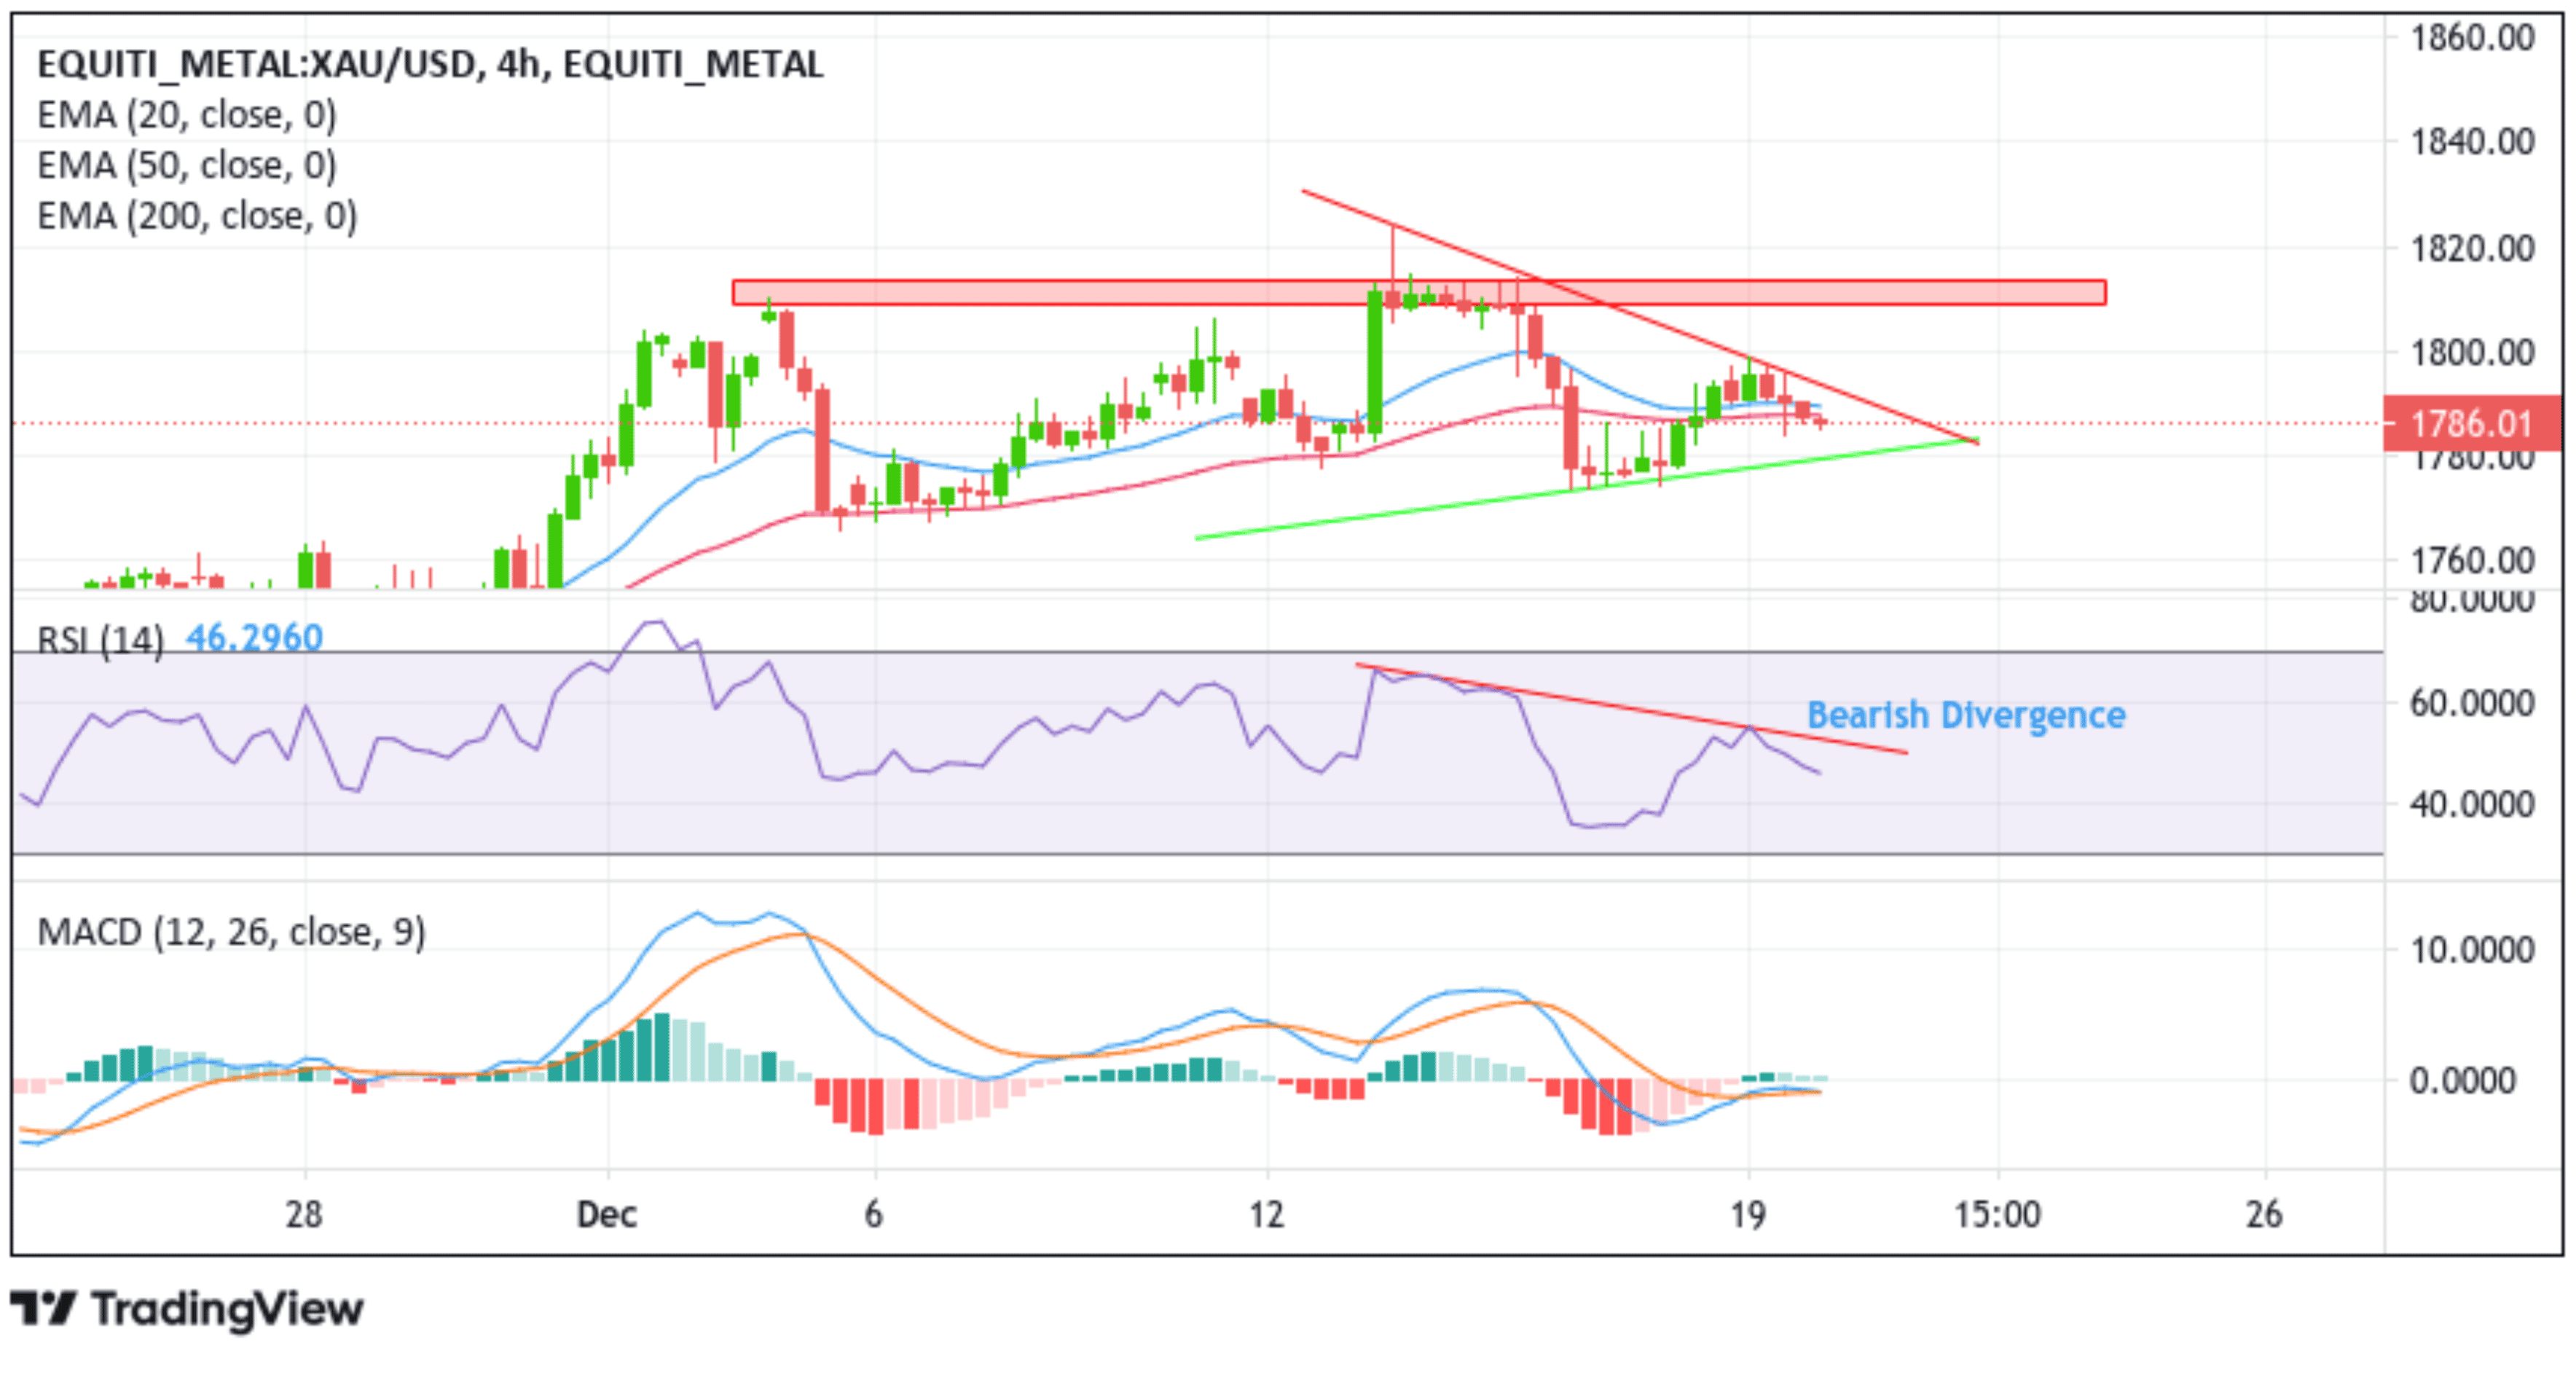
From a technical standstill using a four-hour price chart, the price has extended the modest rebound from the key resistance level plotted by a downward-sloping trendline of a Bullish Pennant Chart Pattern extending from the 13th December 2022 swing high. Some follow-through selling would push spot prices toward the key support level plotted by an ascending trendline extending from the 15th December swing lower lows. Sustained weakness below this barricade (bearish price breakout) would turn the XAU/USD vulnerable and pave the way for aggressive technical selling around the XAU/USD pair. The downfall could then accelerate toward testing the 1774.14 support level. Further weakness below this level would negate any near-term bullish outlook and pave the way for heavy losses around the XAU/USD pair.
The moving average convergence divergence (MACD) crossover is below the signal line painting a bullish filter. The RSI (14) level at 46.290 is below the signal line and portrays a bearish divergence suggesting that the selling pressure could increase.
On the Flipside, if dip-buyers and tactical traders jump back in and trigger a bullish turnaround, Initial resistance appears at the 20 (blue) and 50 (red) Exponential Moving Average (EMA) levels at 1789.67 and 1787.70 levels. Respectively, the key resistance level is plotted by a downward-sloping trendline en route to retesting. If Price Pierces these barriers (bullish price breakout), buying pressure could gain momentum, paving the way for aggressive technical buying. The Bullish trajectory could then accelerate towards the key supply zone ranging from 1809.06 - 1813.27 levels. Sustained strength above this barrier would pave the way for additional gains around the XAU/USD pair.