USD/CAD Seeks To Reclaim Monthly Peak After Hotter Than Expected Inflation Data, PPI Data On Sight


- USD/CAD gains positive traction on Wednesday, eyeing to extend post CPI report gains.
- A substantial leg-up in the U.S. treasury bond yields along with a softer risk tone offered some support to the greenback
- The August Consumer Price Index(CPI) report showed a higher-than-expected reading for inflation
- Declining oil prices undermined the commodity-linked loonie paying more attention to recession woes than the fears of a supply crunch
- U.S. Bureau of Labor Statistics to release the headline producer price index report (PPI) late today during the early North American Session

USD/CAD pair prolonged its recent strong move witnessed yesterday and gained traction for the second successive day on Wednesday and, for now, seems to have snapped a four-day losing streak. The momentum lifted spot prices to a five-week high, around the 1.31709- 1.31839 region during the first half of the Asian Session.
A strong leg-up in the U.S. treasury bond yields and a softer risk tone offered some support to the greenback. They helped to exert upward pressure on the pair as investors bet that a hot inflation reading would keep the Federal Reserve aggressive in tightening monetary policy. As such, the yield on the 2-year Treasury, the part of the curve most sensitive to Fed policy, soared more than 17 basis points to 3.748%. The yield climbed to 3.794% at one point, its highest since November 2007. Meanwhile, the benchmark 10-year Treasury note yield surged 6 basis points, trading at 3.42%.

The U.S. Dollar index(DXY), which measures the value of the United States dollar relative to a basket of foreign currencies, strengthened against a basket of other currencies Tuesday. The August CPI report came in higher than expected, throwing cold water on hopes that inflation had already peaked. The dollar index gained about 0.9% to 109.26 after hotter-than-expected inflation data.
The August consumer price index report showed a higher-than-expected reading for inflation. Headline inflation rose 0.1% month over month, even with falling gas prices. Core inflation rose 0.6% month over month. On a year-over-year basis, inflation was 8.3%. Economists surveyed by Dow Jones had been expecting a decline of 0.1% for overall inflation, with a rise of 0.3% for core inflation. The report is one of the last the Fed will see ahead of their Sept. 20-21 meeting, where the central bank is expected to deliver its third consecutive 0.75 percentage point interest rate hike to tamp down inflation. The unexpectedly high August report could lead the Fed to continue its aggressive hikes longer than some investors anticipated.

The moves come after four straight positive sessions for U.S. stocks, which were bolstered in part by the belief of many investors that inflation had already peaked. "The CPI report was an unequivocal negative for equity markets. The hotter than expected report means we will get continued pressure from Fed policy via rate hikes," said Matt Peron, research director at Janus Henderson Investors. "It also pushes back any 'Fed pivot' that the markets were hoping for in the near term. As we have cautioned over the past months, we are not out of the woods yet and would maintain a defensive posture with equity and sector allocations."

Stocks fall sharply after CPI report
Following the report's release, stocks tumbled across Wall Street at the open on Tuesday, hurting investor optimism for cooling prices and a less aggressive Federal Reserve. The Dow Jones Industrial Average slid 818 points or 2.5%. The S&P 500 dropped 2.9%, and the Nasdaq Composite sank 3.6%. More than 490 stocks in the S&P 500 fell, with Facebook-parent Meta dropping 7.6% and Caesars Entertainment losing 6.7%.
Markets prices bigger than 75 basis points rate hike for next week
Traders are now betting that the August inflation report will force the Federal Reserve to be more aggressive with its rate hikes in the near and longer terms.
The Fed has widely been expected to hike by three-quarters of a point, or 75 basis points next week. The hot CPI report now has some investors thinking a 1 percentage point hike is possible. "Probably 75 (basis points) is the most likely play, but the market is pricing 79 basis points. So there's a shot at 1," said Michael Schumacher of Wells Fargo.
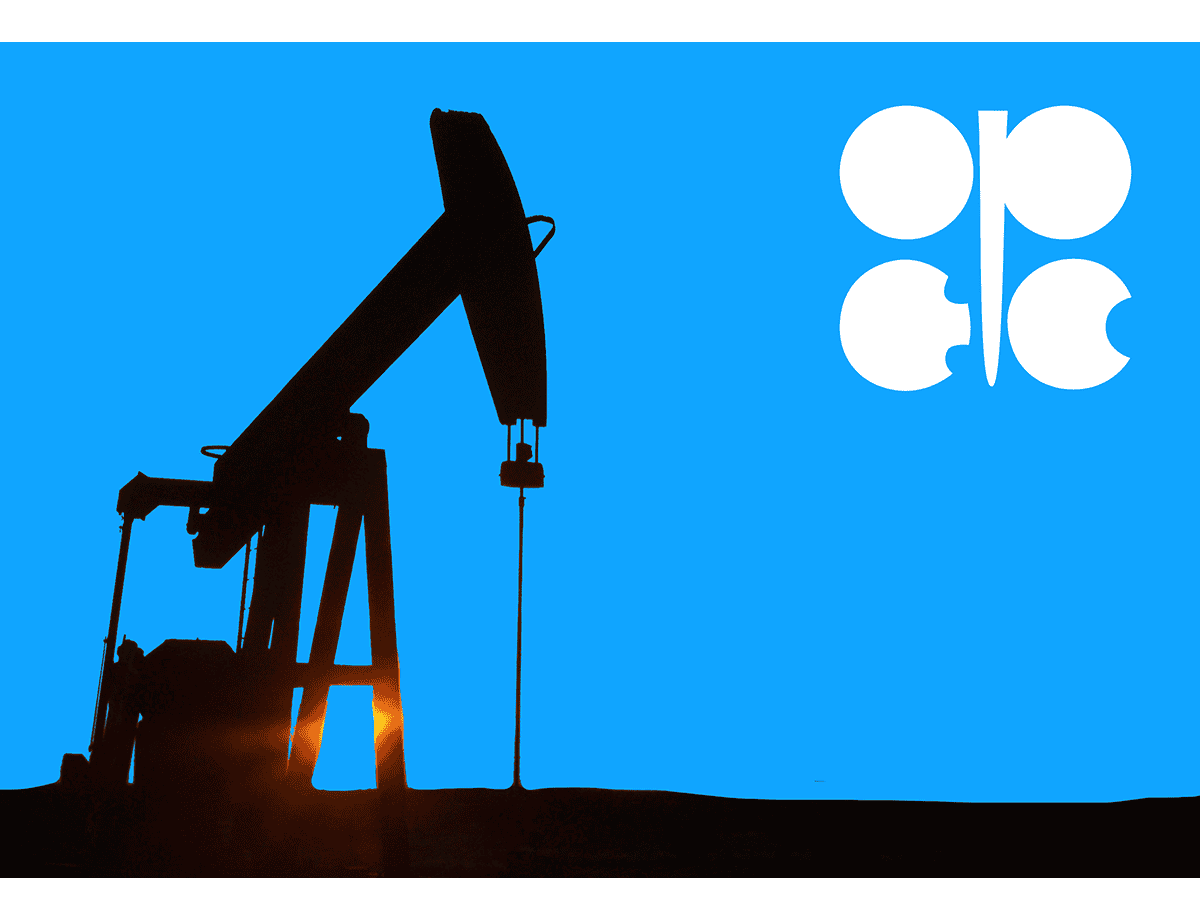
On the Canadian docket, Oil prices fell slightly on Wednesday as concerns over higher-than-expected U.S. CPI inflation data offset a strong demand forecast from OPEC and signs that U.S. gasoline appetite remained robust. Investors should be aware that Canada is a leading exporter of oil to the U.S. and a plunge in the oil prices impact the loonie significantly. London-traded Brent oil futures fell 0.3% to $93.23 a barrel, while U.S. West Texas Intermediate futures were down 0.35% around $87.00 by the press time. In doing so, the black gold pays more attention to the recession woes than the fears of a supply crunch and the optimistic demand forecasts from the Organization of the Petroleum Exporting Countries (OPEC).
As we advance, investors will look for cues from the release of the Crude oil Inventories by the Energy Information Administration, which is expected to show an increase in demand for crude inventories for the week ending on September 14th. Investors will look for further cues from the Canada Manufacturing sales report (MOM) release scheduled for release during the mid-north American session. The primary focus shifts toward the release of the Producer Price Index(PPI) data report later today at 8:30 E.T. (12:30 GMT) and is expected to show Core PPI to be at 0.3%, a rise from last month's 0.2%, while the headline PPI number is also expected to be -0.1%. The report would influence the near-term USD price dynamics. This, in turn, should assist traders in determining the next leg of a directional move for the USD/CAD pair.
Technical Outlook: Four-Hours USD/CAD price Chart
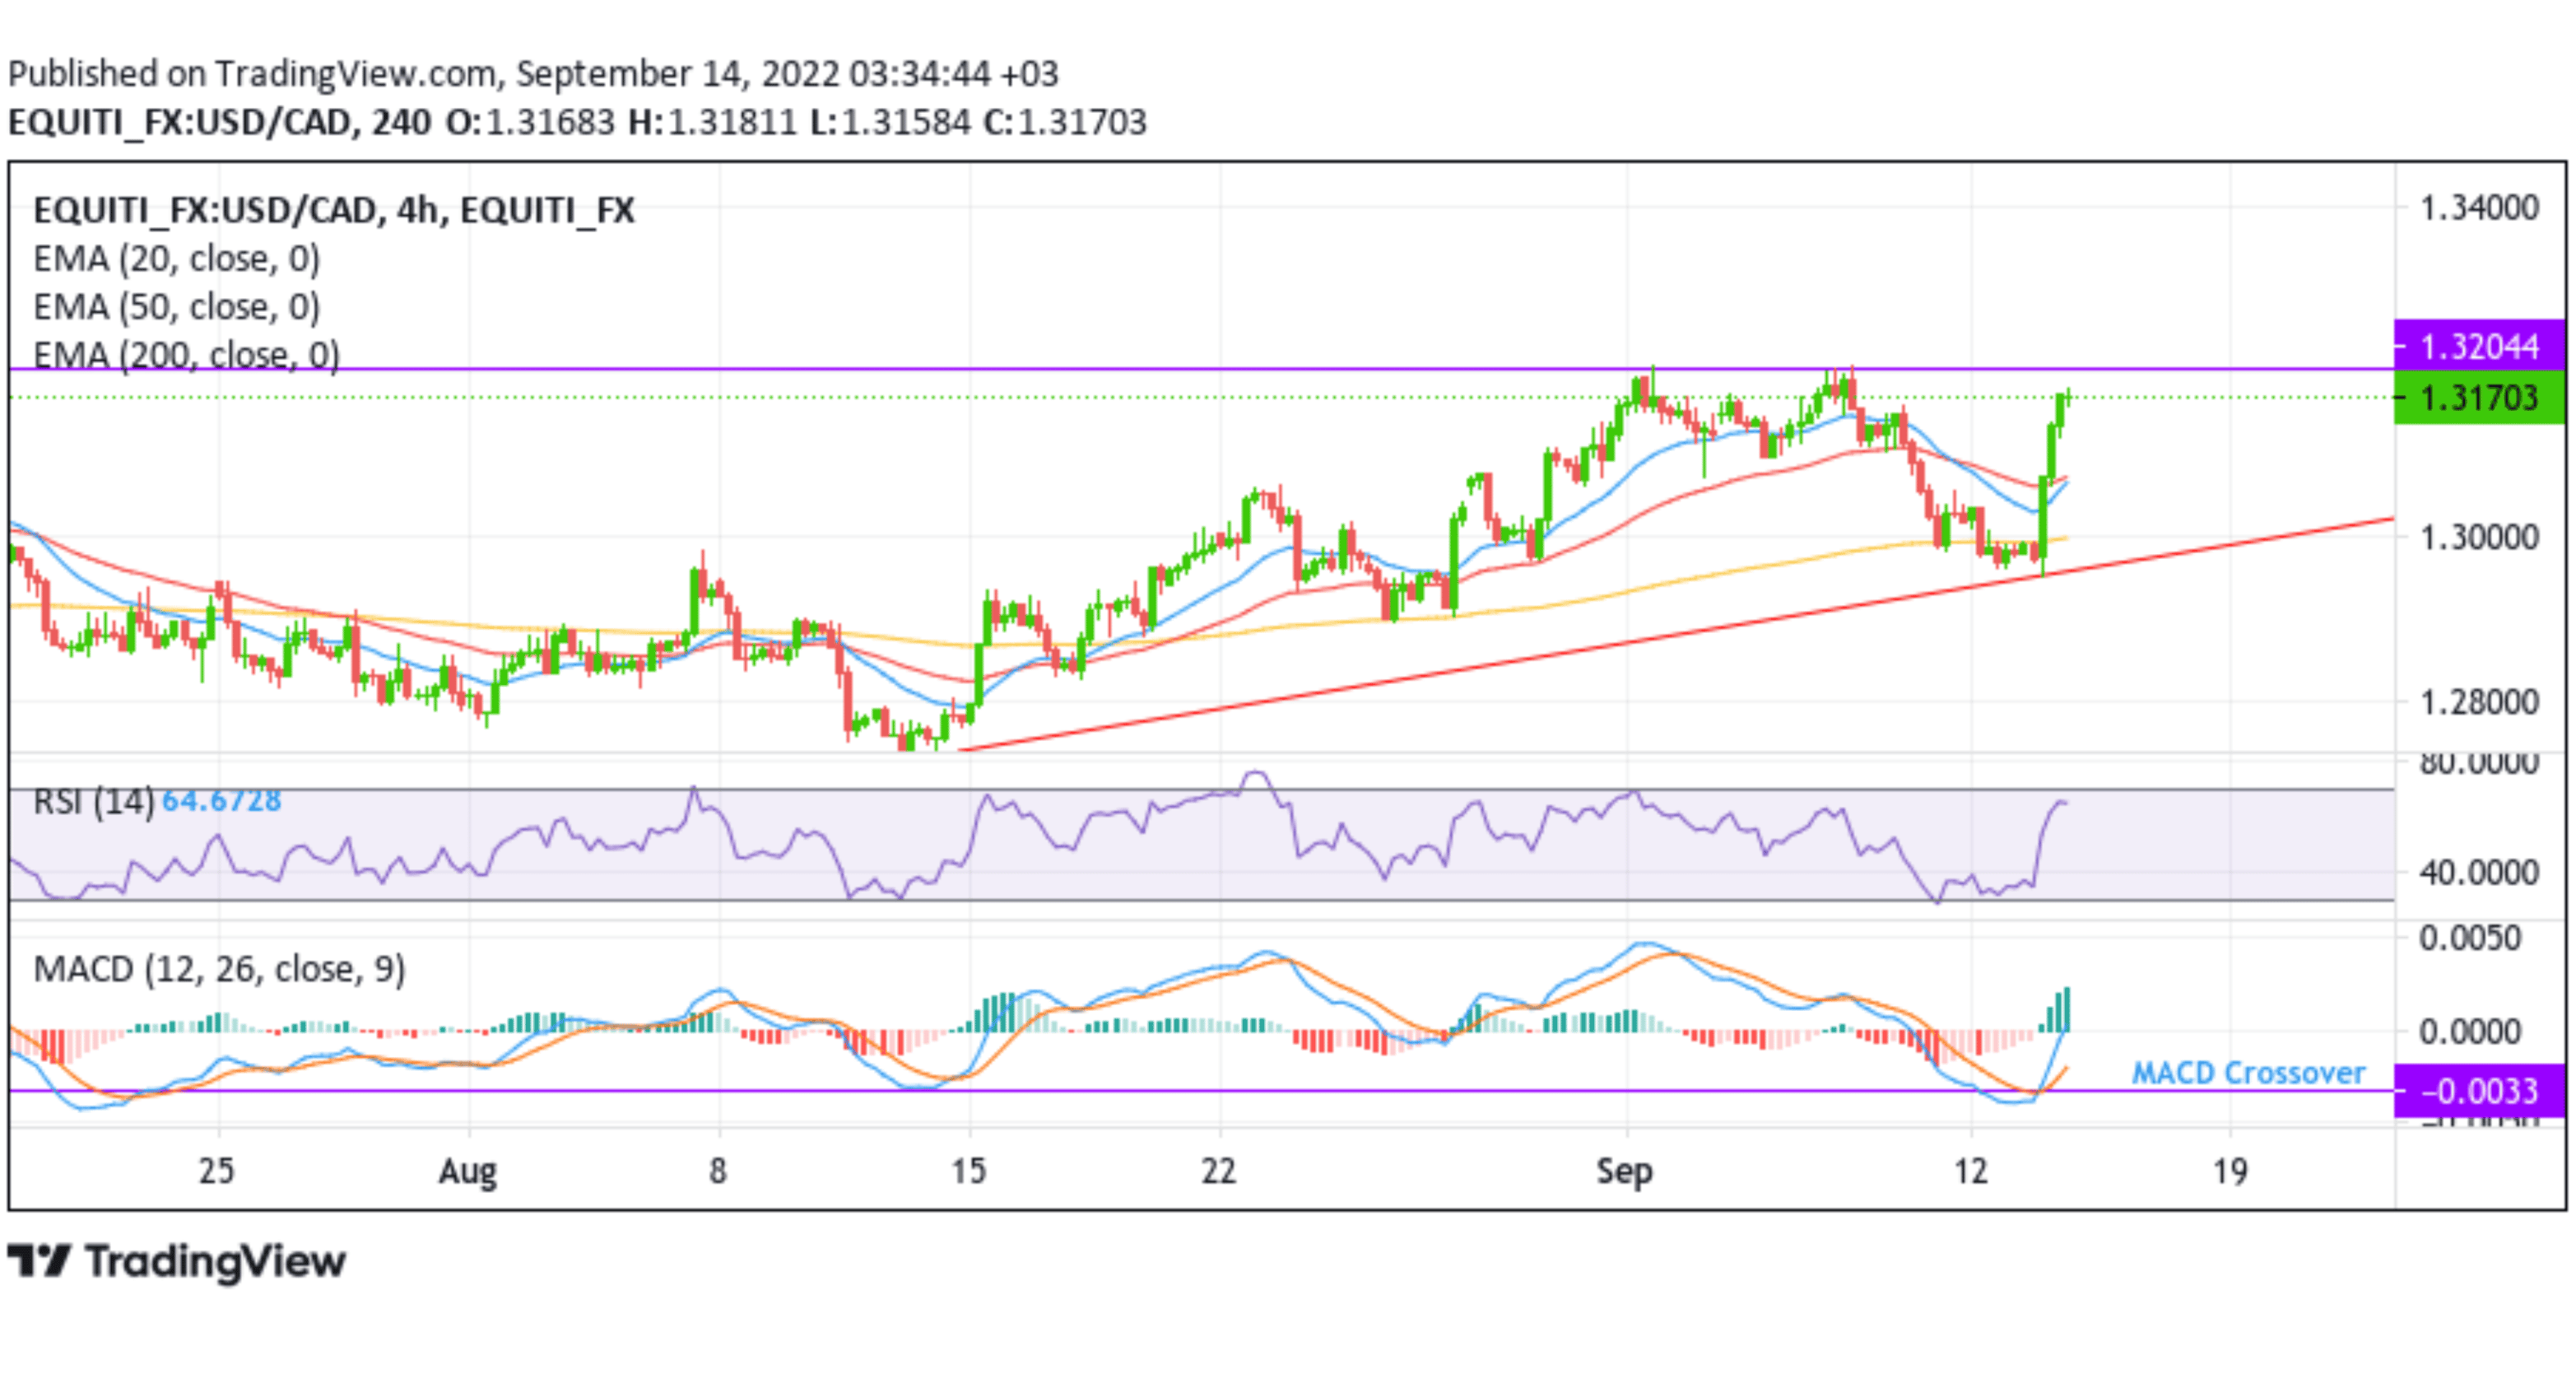
From a technical standstill, using a four-hour price chart, the pair's modest rebound from the upward-ascending trendline plotted from the August 2022 swing low confirmed a strong bullish trajectory. A build-up above the 1.31000 level and the subsequent rise adds credence to the positive outlook. A convincing break above the supply zone ranging from 1.32082- 1.32230 levels will affirm the bullish bias and pave the way for more gains.
The moving average convergence divergence (MACD) crossover at -0.0033 paints a bullish filter. The RSI(14) level at 64.6728 is not far away from flashing overbought conditions warranting traders against submitting aggressive bullish bids. On the other hand, the impending 20 and 50 Exponential Moving Average(EMA) crossover will further add to the upside bias.
On the flip side, any meaningful pullback now seems to find some support near the 1.30986-1.31133 levels. This is followed by the 1.31000 round-figure mark, which, if broken decisively, will negate the positive outlook and prompt aggressive technical selling. The downward trajectory could then accelerate toward retesting the upward-ascending trendline.