Gold Rallies Above The 1713 Level Amid Declining Treasury Bond Yields


- XAU/USD attracts fresh buying on Tuesday
- The ongoing steep decline in treasury bond yields forces the U.S. dollar to trim its gains and retreat from a two-decade high, in turn offering support to XAU/USD
- Deteriorating Global economic outlook weighs on investor's sentiments, further benefitting safe-haven Gold

XAU/USD Pair has been oscillating in a narrow range of 1709.75 - 1718.07 since last Friday as cautious investors focused on the U.S. Federal Reserve's rate-hike path following mixed jobs data. That said, the cross met fresh demand on Tuesday during the early hours of the Asian session after attracting fresh bullish bets from the vicinity of the 1710.98 level to open up from a gap down and lift spot prices to a fresh daily high. At the time of speaking, the Pair is up over 46 pips for the day and has recovered most of its previous losses.

The ongoing steep decline in the U.S. treasury bond yields amid receding bets for more aggressive fed rate hikes and signs of stability in the U.S. financial markets forced the U.S. dollar to trim the majority of its intraday gains and retreat from the record 20-year level touched early on Monday. This, in turn, offered some support to the dollar-denominated commodity.
Odds that the FED will hike interest rates by 75 bps in September have significantly reduced recently, with Fed Funds Futures markets now pulling back anticipation for a third consecutive 0.75 percentage point rate increase at the September meeting. The probability for that move was 62% around 10 a.m. E.T., down from 75% on Thursday.
This came after a mixed Jobs data report released last week on Friday, which showed that the U.S. economy continues to remain resilient despite the recent economic headwinds increasing the likelihood of a softer-landing.
The deteriorating global economic outlook continues to weigh on investors' sentiment, which further benefits the safe-haven Gold. Investor's worst fears of a looming energy crisis in Europe were confirmed on Monday after Russian energy supplier Gazprom said on Friday it would not resume its supply of natural gas to Germany through the key Nord Stream 1 pipeline, blaming a malfunctioning turbine. The announcement was made hours after the Group of Seven economic powers agreed on a plan to implement a price cap on Russian oil. As such, the front-month gas price at the Dutch TTF hub, a European benchmark for natural gas trading, was nearly 30% higher Monday morning, hitting 282.5 euros per megawatt hour.

Moreover, the fresh COVID-19 lockdowns in China to curb the latest outbreak and the ongoing war in Ukraine further dampen the market mood. Apart from this, the continuous rise in inflationary pressures also lends some support to the non-yielding bullion, which is considered a hedge against inflation. The combination of factors undermined the greenback and drove some haven flows toward the non-yielding yellow metal.
As we advance, the focus now shifts toward the US ISM Non-Manufacturing PMI report scheduled for release today during the mid-North American session. The report is likely to show that the economic activity in the service sector for September contracted after expanding in the last two months. The ISM Non-manufacturing PMI data is expected to land at 55.1 against the prior figure of 56.7. That said, the report will influence the U.S. Dollar price dynamics and allow traders to grab some trading opportunities around the Pair.
Technical Outlook: XAU/USD Four-Hour Price Chart
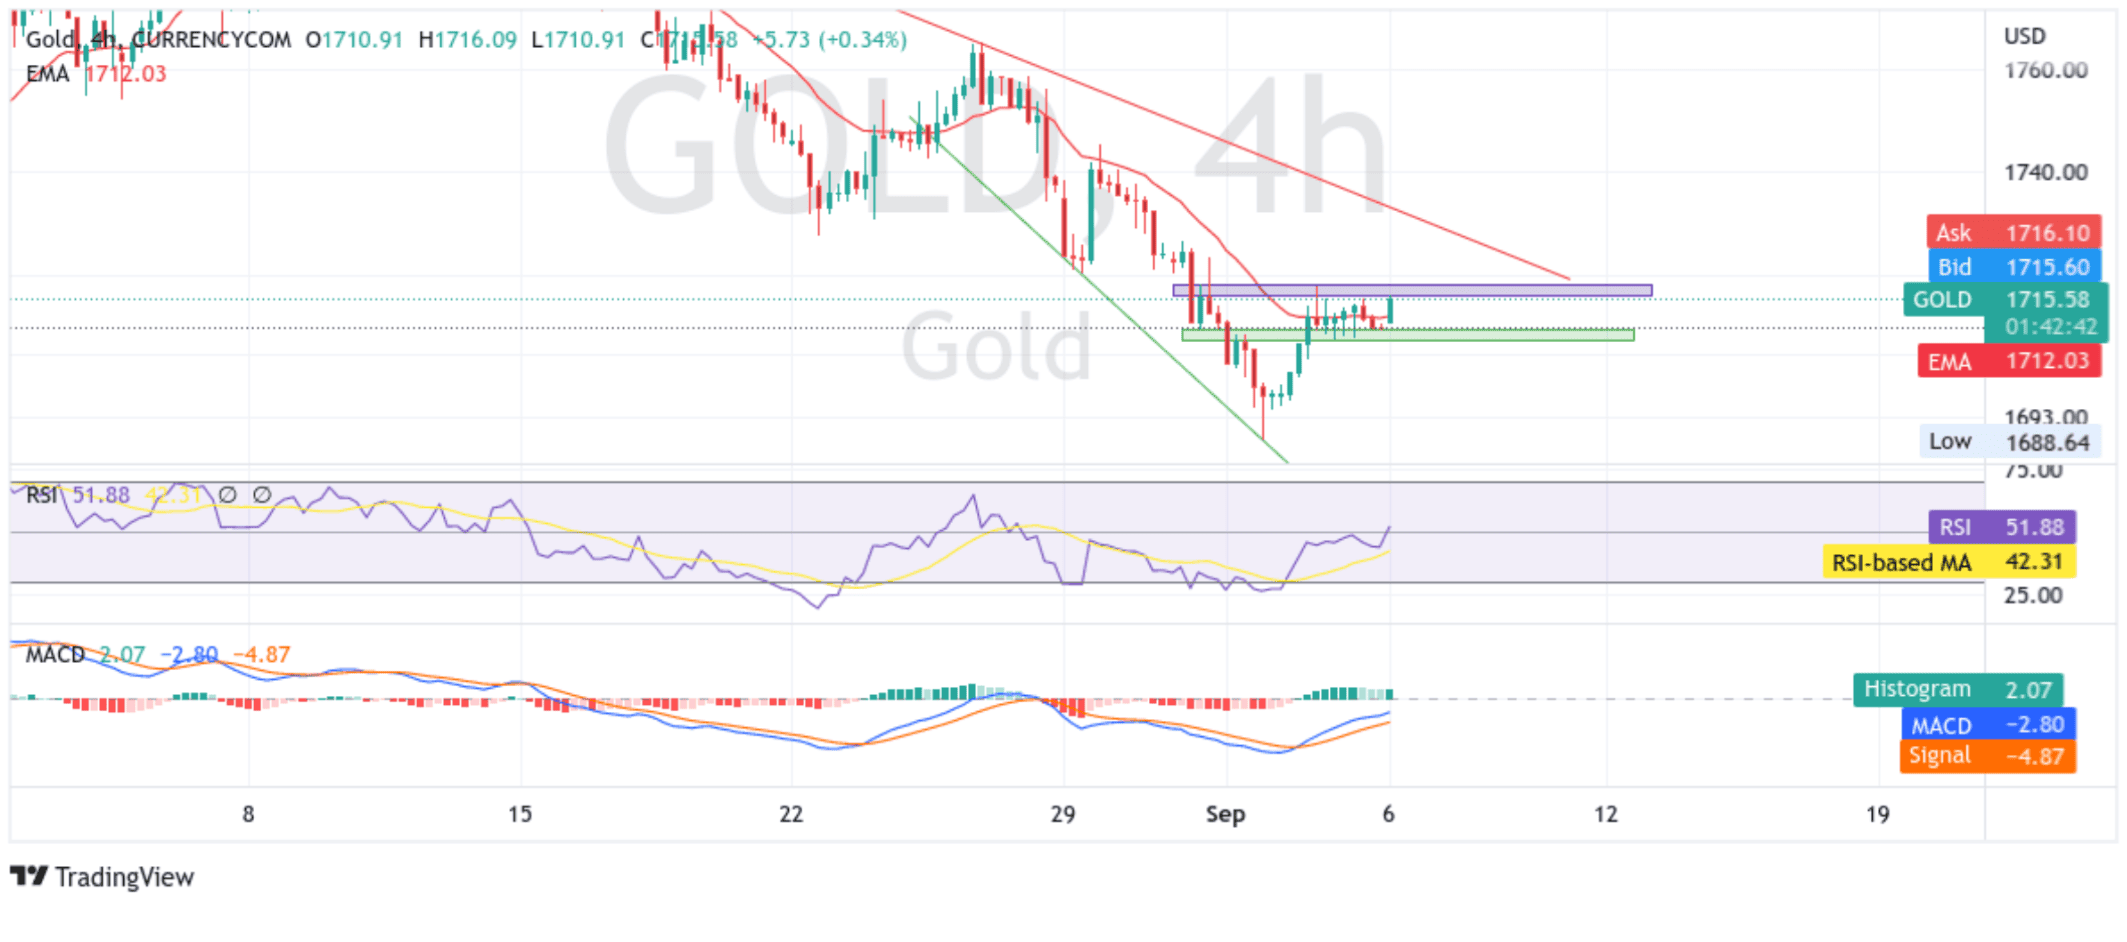
From a technical perspective, the price opened on Tuesday in a firmer responsive bullish move after a gap-down(bullish open gap), denoting a bargain buy for investors. The bullish uptick has managed to fill in the gap but faces an immediate hurdle ranging from 1715.66 - 1718.07 level. A convincing break above the key supply zone would pave the way for additional gains. The upward trajectory could then accelerate toward testing the downward-sloping trendline from the August 2022 swing high. However, it will be met by stiff resistance from the critical 50-day Exponential Moving Average(EMA) level, currently at 1722.81 level. Acceptance above the aforementioned EMA level, followed by sustained strength above horizontal resistance, will reaffirm the positive bias and pave the way for aggressive technical buying.
The RSI(14) level at 51.88 is above the 50-neutral level, While The moving average convergence divergence (MACD) crossover at -9.90 adds to the bullish filter. Additionally, the 20-day Exponential Moving Average(EMA) pointing upwards adds to the bullish bias.
On the Flipside, a pullback towards retesting the demand zone ranging from 1707.31 - 1709.75 level followed by a convincing break below the aforementioned zone would negate any near-term bullish bias and pave the way for aggressive technical selling. The downward trajectory could then accelerate toward the key demand zone ranging from 1680.24 - 1689.20 levels, though it will face some resistance from the 61.8% Fibonacci retracement level at 1703.40 level.