USD/CAD Price Rebounds From Key Support Level To Start Of A New Month


- USD/CAD gains positive traction on Monday
- Fresh leg up in ten-year bond yields offers support to safe-haven greenback
- Declining oil prices undermine loonie
USD/CAD cross attracted some deep buying in the vicinity of 1.27936 level on the first day of the week and staged a modest intraday recovery from a two-week low to lift spot prices to a fresh daily high during the early Asian session. At the time of speaking, the pair is up over 20pips for the day and seem to have snapped a three-day losing streak. The pair looks set to build upon its steady intraday ascent heading into the European session.
A fresh leg up in the US Treasury Bond Yields and a softer risk tone offered some support to the safe haven-green back. This came on the backdrop of a mixed batch of economic data. Apple’s revenue rose 2% during the quarter, compared to 36% growth during the same period last year and over 8% growth in the march quarter, according to the latest report released on Friday. Additionally, Apple shares climbed 3.2% after posting better-than-expected iPhone revenue. Amazon shares climbed more than 13% in extended trading on Thursday after the company reported better-than-expected second-quarter revenue and gave an optimistic outlook.
The positive earnings report came as investors shook off three-quarters of a percentage hike from the federal reserve on Wednesday and negative GDP reading on Thursday. It is worth remembering last week on Wednesday the FED raised its interest by 75 basis points its second consecutive interest rate, taking its benchmark rate to a range of 2.25%-2.5% as it seeks to tamp down runaway inflation that had risen to a four-decade high without creating a recession.
The latest inflation figures released last Thursday showed that inflation continued its red-hot rise in June. The Personal consumption expenditure(PCE) index rose 6.8%, the biggest 12-month move since the 6.9% increase in January 1982. According to the report, the personal consumption expenditure-a gauge of consumer spending, PCE increased 1.1% for the month, above the 0.9% estimate and owing largely to the surge in prices.
According to the latest GDP report, the US economy contracted for the second quarter. Gross domestic product fell 0.9% at an annualized pace for the period, according to the advance estimate. That followed a 1.6% decline in the first quarter and was worse than the Dow Jones estimate for a gain of 0.3%. A second consecutive negative quarter for GDP provides further evidence that, at best, economic momentum continued its marked slowdown. The negative GDP reading meets a long-held, basic view of recession, which FED officials have outrightly denied that the US economy is in recession. FED Chair Jerome Powell last week denied the US is in recession as he said job growth and wage measures are firm and not consistent with a recession.
On the Canadian docket, declining oil prices amid supply concerns undermined the loonie. Investors should be aware that Canada is a leading exporter of oil to the US and a plunge in the oil prices impact the loonie significantly. Attention now turns to the next meeting of the Organization of the Petroleum Exporting Countries (OPEC) and allies led by Russia, known as OPEC+, on Aug. 3, in which a decision to raise oil output is expected. That said, Today is a holiday in Canada(Civic holiday), so no big market movement is expected from the Canada docket.
Going forward, investors will look for fresh cues from the manufacturing PMI report scheduled for release Today during the early north-American session. The report would influence USD price dynamics and provide trading opportunities around the pair.
Technical Outlook: Four-Hours USD/CAD price Chart
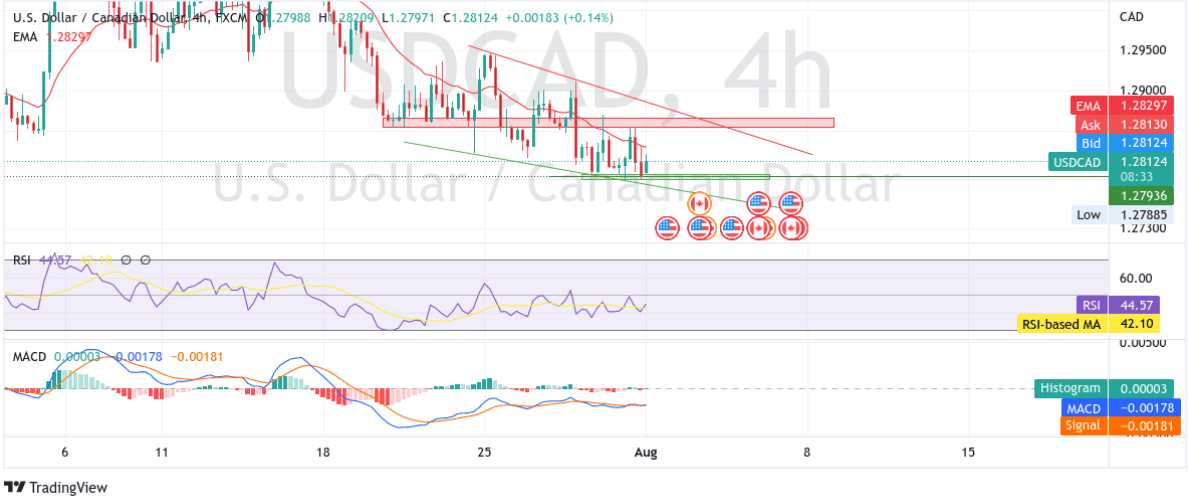
From a technical perspective using a four-hour price chart, the price rebounded modestly from a key support zone ranging from 1.27833-27958 levels. Strong follow-through buying would lift spot price to the immediate hurdle ranging from 1.28538-1.28660 levels. The said barrier if cleared decisively would pave the way for more gains and push the asset to the next barrier which is the upper horizontal trendline of the descending channel pattern formation. The trendline turned resistance zone is plotted from 25th July and would act as a barricade against the pair.
The RSI(14) level at 44.57 is far from the overbought territory and still below the neutral level. The moving average convergence divergence (MACD) crossover later today will add to the bullish filter. Acceptance above the 20 Exponential Moving Average(EMA) at the 1.28301 level would validate our bullish filter.
On the flip side, a pullback towards the support zone which coincides with the lower horizontal trendline of the descending channel pattern followed by a subsequent break below the aforementioned support zone would negate any near-term bullish bias and pave the way for aggressive technical selling.