USD/JPY Weakens Further After Hawkish FED Interest Rate Decision


- USD/JPY pair sees fresh selling on Thursday to extend more losses for the shared currency
- Short-dated two-year JGB offers some support to the safe-haven Japanese Yen
- FED hike its interest rate by 0.75 percentage points for the second consecutive time
USD/JPY pair witnessed heavy selling on Thursday during the early part of the Asian session to extend Wednesday's modest pullback from the key resistance zone and add to the Post FOMC interest rate decision losses. The cross met fresh supply from the vicinity of 136.538 level and dragged spot prices from the previous day's low to extend the sharp pullback from the weekly high. At the time of speaking, the pair is down 20 pips for the day and looks set to maintain its offered tone heading into the European session.
A fresh leg-up in the short-dated two-year Japanese government bonds saw the Japanese Yen Basket(JPYBASKET) rebound modestly from the weekly low to rally up and recover some part of its early lost ground. This in turn, was seen as a key factor that undermined the Greenback and offered some support to the pair.
Fed hiked interest rates by 0.75 Percentage point
The federal reserve on Wednesday raised its interest by 75 basis points, its second consecutive interest rate, taking its benchmark rate to a range of 2.25%-2.5% as it seeks to tamp down runaway inflation that had risen to a four-decade high without creating a recession. Most investors expected the move after the FED officials telegraphed the increase in statements since the June Meeting. The hawkish monetary policy stance by the FED remained supportive of Elevated US ten-year treasury Bond yields, which in turn was seen as a factor that helped to cap the USD/JPY pair against any further downtick.
However, it is worth noting that most FED officials have emphasized the importance of bringing down inflation, even if it means slowing the economy. This, in turn, was seen as a factor that undermined the Greenback and offered some support to the safe-haven Japanese Yen, and as a result, the US Dollar index(DXY) reversed modest intraday gains and was last seen trading below the 106.330 level on Thursday. The downside remains cushioned amid a significant divergence in the monetary policy stance adopted by the Bank of Japan(Dovish Stance) and the FED(Hawkish). In the June policy meeting, Japan's bank announced no change to its monetary policy, meaning it will continue to keep its ultra-loose policy settings. Additionally, the Bank of Japan offered to purchase ten-year Japanese government bonds at 0.25% every business day through fixed-rate purchase operations to defend its near-zero ten-year yields.
Going forward, investors will look for fresh cues from the release of the US GDP report and the initial jobless claims report scheduled for release during the early north-American speech. Furthermore, traders will look for fresh directional impetus from the FED chair Mrs Janet Yellen. Her speech would influence near-term USD price dynamics and allow traders to grab some trading opportunities around the USD/JPY pair.
Technical Outlook: Four-Hours USD/JPY Price Chart
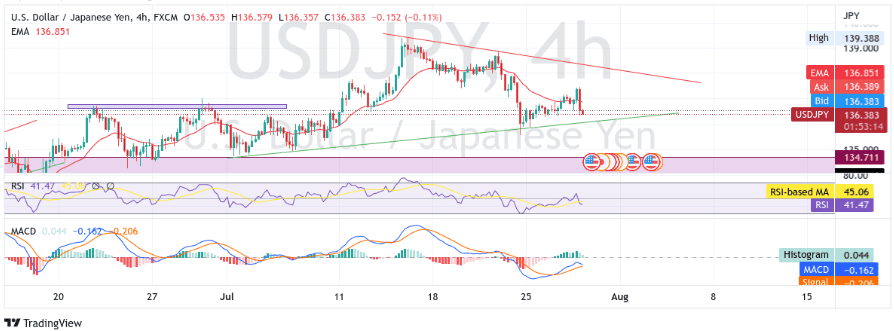
From a technical perspective using four hours price chart, the price has extended Wednesday's modest pullback from the key resistance zone ranging from 136.367-137.779 levels. Some follow-through selling would push the asset to test the immediate hurdle, the lower horizontal trendline of the descending wedge pattern plotted from 1st July. If broken decisively, the barricade would negate any near-term bullish bias and pave the way for more losses. The RSI(14) level at 41.47 is below the 50.0 neutral but still far from the oversold territory. The moving average convergence divergence (MACD) crossover will add to the bearish filter later today. The 20 and 50 Exponential Moving Average(EMA) crossover at 137.652 validates our bearish filter. On the flip side, a pullback toward testing the upper horizontal trendline of the descending wedge pattern followed by a subsequent break above the aforementioned trendline turned resistance zone would pave the way for aggressive technical buying.