EUR/USD Eases Further Below The 1.06000 Mark Amid Downturn China Factory Activity, FED's Minutes Awaited


- EUR/USD Pair witnessed some selling on Tuesday and extended a modest rebound from the vicinity of the 1.07126 level
- Rising Treasury Bond Yields underpines the Greenback
- Data from China released on Tuesday showed factory activity shrank last month, which in turn offered some support to the Greenback
- Eurozone manufacturing downturn eases in December
- The Fed is set to release the minutes of its December Meeting on Wednesday

EUR/USD cross came under renewed selling pressure on Tuesday during the first part of the Asian session and extended the modest rebound from the vicinity of the 1.07126 level touched last Friday. At the time of speaking, the pair is down over 10 pips for the day and looks set to maintain its offered tone heading onto the European session.
Rising Treasury Bond yields as investors ushered in a New Year ahead of an important week featuring a slew of economic data, including minutes of the last Federal Reserve meeting that will shed light on the Central bank's thinking around interest rates and inflation turned out to be a key factor that offered some support to the greenback.
As per press time, the U.S. Dollar Index, which measures the greenback against a basket of six other currencies, was up 0.14% at 103.796, off roughly six-month lows hit last week at around 103.38 and made a subdued start to 2023. It is worth noting. The index rose 8% last year in its most significant annual jump since 2015 on the back of the Fed raising interest rates to tackle inflation.
Commenting on the greenback, The dollar is likely to consolidate as "market activity gradually picks up this week," said Christopher Wong, currency strategist at OCBC Bank in Singapore.
After delivering four consecutive 75 basis points hikes, the U.S. Central Bank raised interest rates by 50 basis points last month, signalling the FED had started to slow down its rate hikes. Markets are now pricing in rate cuts for late 2023, with Fed fund futures implying a range of 4.25 to 4.5% by December. It is worth noting the Fed tightening helped lift the dollar index by 8% last year in its most significant annual jump since 2015. That said, investors now look forward to the minutes of the December meeting, which will be released on Wednesday, with investors looking for cues on what path the Fed is likely to take in 2023.
Citi strategists say the minutes might become more attractive as there could be more divergence between the doves and the hawks regarding how high the terminal rate should go.
"We will also be looking for any guide on what could determine the size of the hike at the February meeting, but would not expect any concrete guidance," Citi said, adding they continue to expect a 50 basis points hike in February.

Data from China released Tuesday showed factory activity shrank last month at the sharpest pace in nearly three years. The Caixin China General Manufacturing PMI fell to 49.0 in December 2022 from 49.4 in November, pointing to the lowest print since September, amid a spike in COVID cases that disrupted production. The latest result also marked the fifth straight month of drop in factory activity, compared with the market consensus of 48.8, with output, new orders, and export sales all declining further. That said, the downbeat macroeconomic data from the second-largest economy in the world was seen as a factor that offered some support to the greenback and, in turn, exerted downward pressure on the EUR/USD pair.
Shifting to the European docket, a Markit Economics data report on Monday showed a downturn in eurozone manufacturing activity last month had likely passed its trough. The S&P Global Eurozone Manufacturing PMI was confirmed at 47.8 in December 2022, above the previous month's 47.1 and indicating the softest downturn in the sector since September, as inflationary pressures eased and supply chains continued to stabilize. Despite the modest rebound, the latest data is still below the 50 mark separating growth from contraction.
While the euro area economy is heading for a recession, concerns about gas supply over the winter have eased, meaning a downturn may not be as bad as feared a few months ago.
Eurozone wages are growing quicker than thought, and the European Central Bank (ECB) must prevent this from adding to already high inflation, ECB Chief Christine Lagarde said at the weekend.
"The recent euro strength is driven by a mix of things including both the hawkish ECB commentary and hopes of a peak in U.S. rates," said Danske Bank chief analyst Piet Haines Christiansen."It is also supported by hopes that the energy supply in natural gas is not as bad a situation as feared."
As we advance, investors now look forward to the German Consumer Price Index (CPI) data which is expected to show a slowdown in inflation in Germany and land at 9.1%, down from 10% the previous month. Additionally, investors will look for cues from the release of the U.S. Manufacturing PMI data report, which is expected to show a downturn in manufacturing activity in the U.S. and land at 46.2, down from 47.7. However, the focus remains on the FED's Minutes set for release on Wednesday.
Technical Outlook: Four-Hours EUR/USD Price Chart
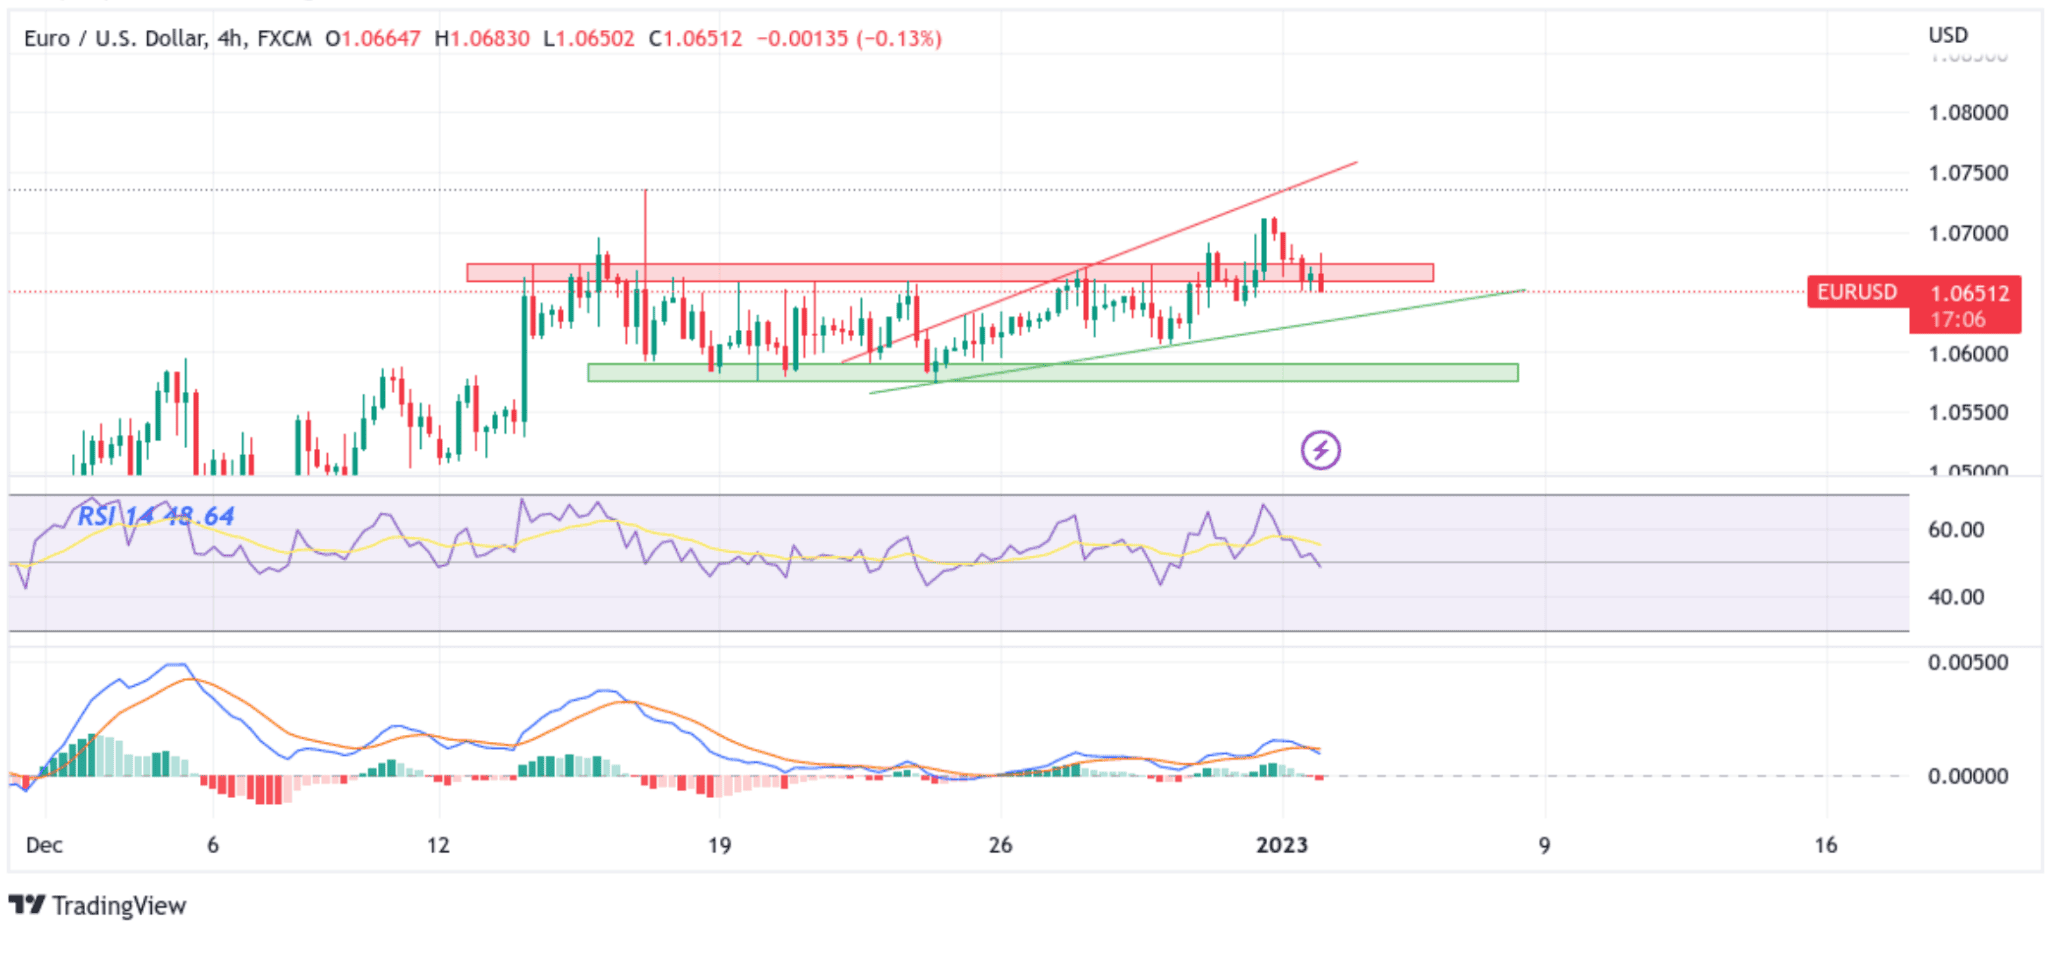
From a technical standstill, using a four-hour price chart price, the price has extended the modest rebound from the vicinity of the 1.07126 level, and as per press time price has managed to break below the supply zone ranging from 1.06575 - 1.06733 levels. Some follow-through selling would drag spot prices toward the key support level plotted by a rising upward trendline of the rising wedge chart pattern extending from the 22nd December 2022 swing Lower-low. Sustained weakness below the aforementioned support level (bearish price breakout) would pave the way for aggressive technical selling around the EUR/USD pair. The bearish trajectory could then accelerate toward the Demand zone ranging from 1.05741 - 1.05910 levels. If bears break below this floor, downside momentum could pick up the pace and pave the way for more losses surrounding the EUR/USD Pair.
The RSI (14) on the four-hour chart is at 48.64 and below the signal line, portraying a bearish filter. The Moving Average Convergence Divergence (MACD) Crossover, on the other, is above the signal line, pointing to a bullish sign for price action this week, but a move below the signal line would act as a sell signal.
On the flip side, if buyers resurface and spark a bullish turnaround, initial resistance comes in at the 1.06917 resistance level en route to the 1.07154 resistance level. On further strength, the focus shifts higher toward retesting the key resistance level plotted by a rising upward trendline of the rising wedge chart pattern extending from the 22nd December 2022 swing to higher highs. If the price pierces this barrier, it will pave the way for additional gains surrounding the EUR/USD Pair.