S&P 500 Futures Inches lower As Wall Street Awaits Final Trading Day Of 2022


- S&P 500 Futures witnessed some selling on the final trading day of 2022 and extended the modest rebound from the 3859.95 level
- Job filings continued to rise last week, according to data released on Thursday by the US Department of Labor
- Tesla Shares are up 8%
- The best-performing sector on Friday was the Financial Sector, while the Health sector was the worst performer

The S&P 500 Futures Index edged lower through the early Asian session and dropped below the 3840.00 mark in the last hour. The S&P 500 Index Futures capitalised on the overnight rebound and witnessed some follow-through selling on the final trading day of the worst year for stocks since 2008.
As per press time, the S&P 500 Futures Index has slipped more than 0.17%/ 60 pips for the day to trade at $3840.45, adding further to the overnight losses.
The overnight moves followed a rally during the regular trading session, with S&P 500 climbing about 1.8% after an initial jobless claims data report showed job filings continued to rise last week, matching market expectations.
According to data released Thursday by the US Department of Labour, jobless claims increased last week amid Federal Reserve efforts to cool the economy and, particularly, the labor market.
First-time filings for unemployment benefits totalled 225,000 for the week ended Dec. 24, the Labor Department reported Thursday. That increased by 9,000 from the previous week and slightly above the 223,000 estimates from Dow Jones.
Today marks the final day of trading what's been a painful year for stocks. A volatile bear market, sticky inflation, and aggressive rate hikes from the Federal Reserve battered growth and technology stocks. These factors also weighed on investor sentiment.
Despite the yearly losses, the S&P 500 is up 7.35% and slated to break three consecutive quarterly losses. While its counterpart, Nasdaq 100, has so far slipped 0.92% for the fourth consecutive negative quarter for the first time since 2001.
All major S&P sectors finished Thursday with gains, led to the upside by communication services. Consumer discretionary and communication services are the only sectors headed for losses for the quarter. Energy is the only sector on pace for yearly gains after surging nearly 58%.
Tesla Shares are up 8%
Tesla Inc (NASDAQ: TSLA), up 8%, continued to claw back losses as some on Wall Street flagged several key milestones that the electric vehicle manufacturer's chief executive Elon Musk needs to achieve to lift sentiment on the stock.
Musk needs to "name a CEO of Twitter by the end of January; adopt a 10b5-1 plan so investors know there is no major selling block around the corner and lay out conservative 2023 delivery and targets given the darker macro," Wedbush said in note laying out the "top 10 things Musk needs to do in 2023 to turn TSLA sentiment positive."
In the S&P 500 Index, the best-performing sector on Friday was the Financial Sector led by SVB Financial Group (NASDAQ: SIVB), which rose 8.40%/18.18 points to trade at $234.63 per share. Consumer discretionary followed second, topped by Tesla Inc (NASDAQ: TSLA), which gained 8.08%/9.11 points to trade at $121.82 per share. Communication Services came in third, led by Warner Bros Discovery Inc (NASDAQ: WBD), which added 6.31%/0.56 points to trade at $9.43 per share.
On the other hand, the worst performing sector was the health sector, led by Cardinal Health Inc (NYSE: CAH), which lost 1.12%/0.88 points to trade at $77.72 per share. The materials sector came in second, topped by CF Industries Holdings (NYSE: CF), which declined 0.96%/0.83 points to trade at $85.51 per share. The Information Technology sector came in third, led by Enphase Energy Inc (NASDAQ: ENPH), which shed 0.71%/1.89 points to trade at $265.49 per share.
Technical Outlook: Four-Hours S&P 500 Index Price Chart
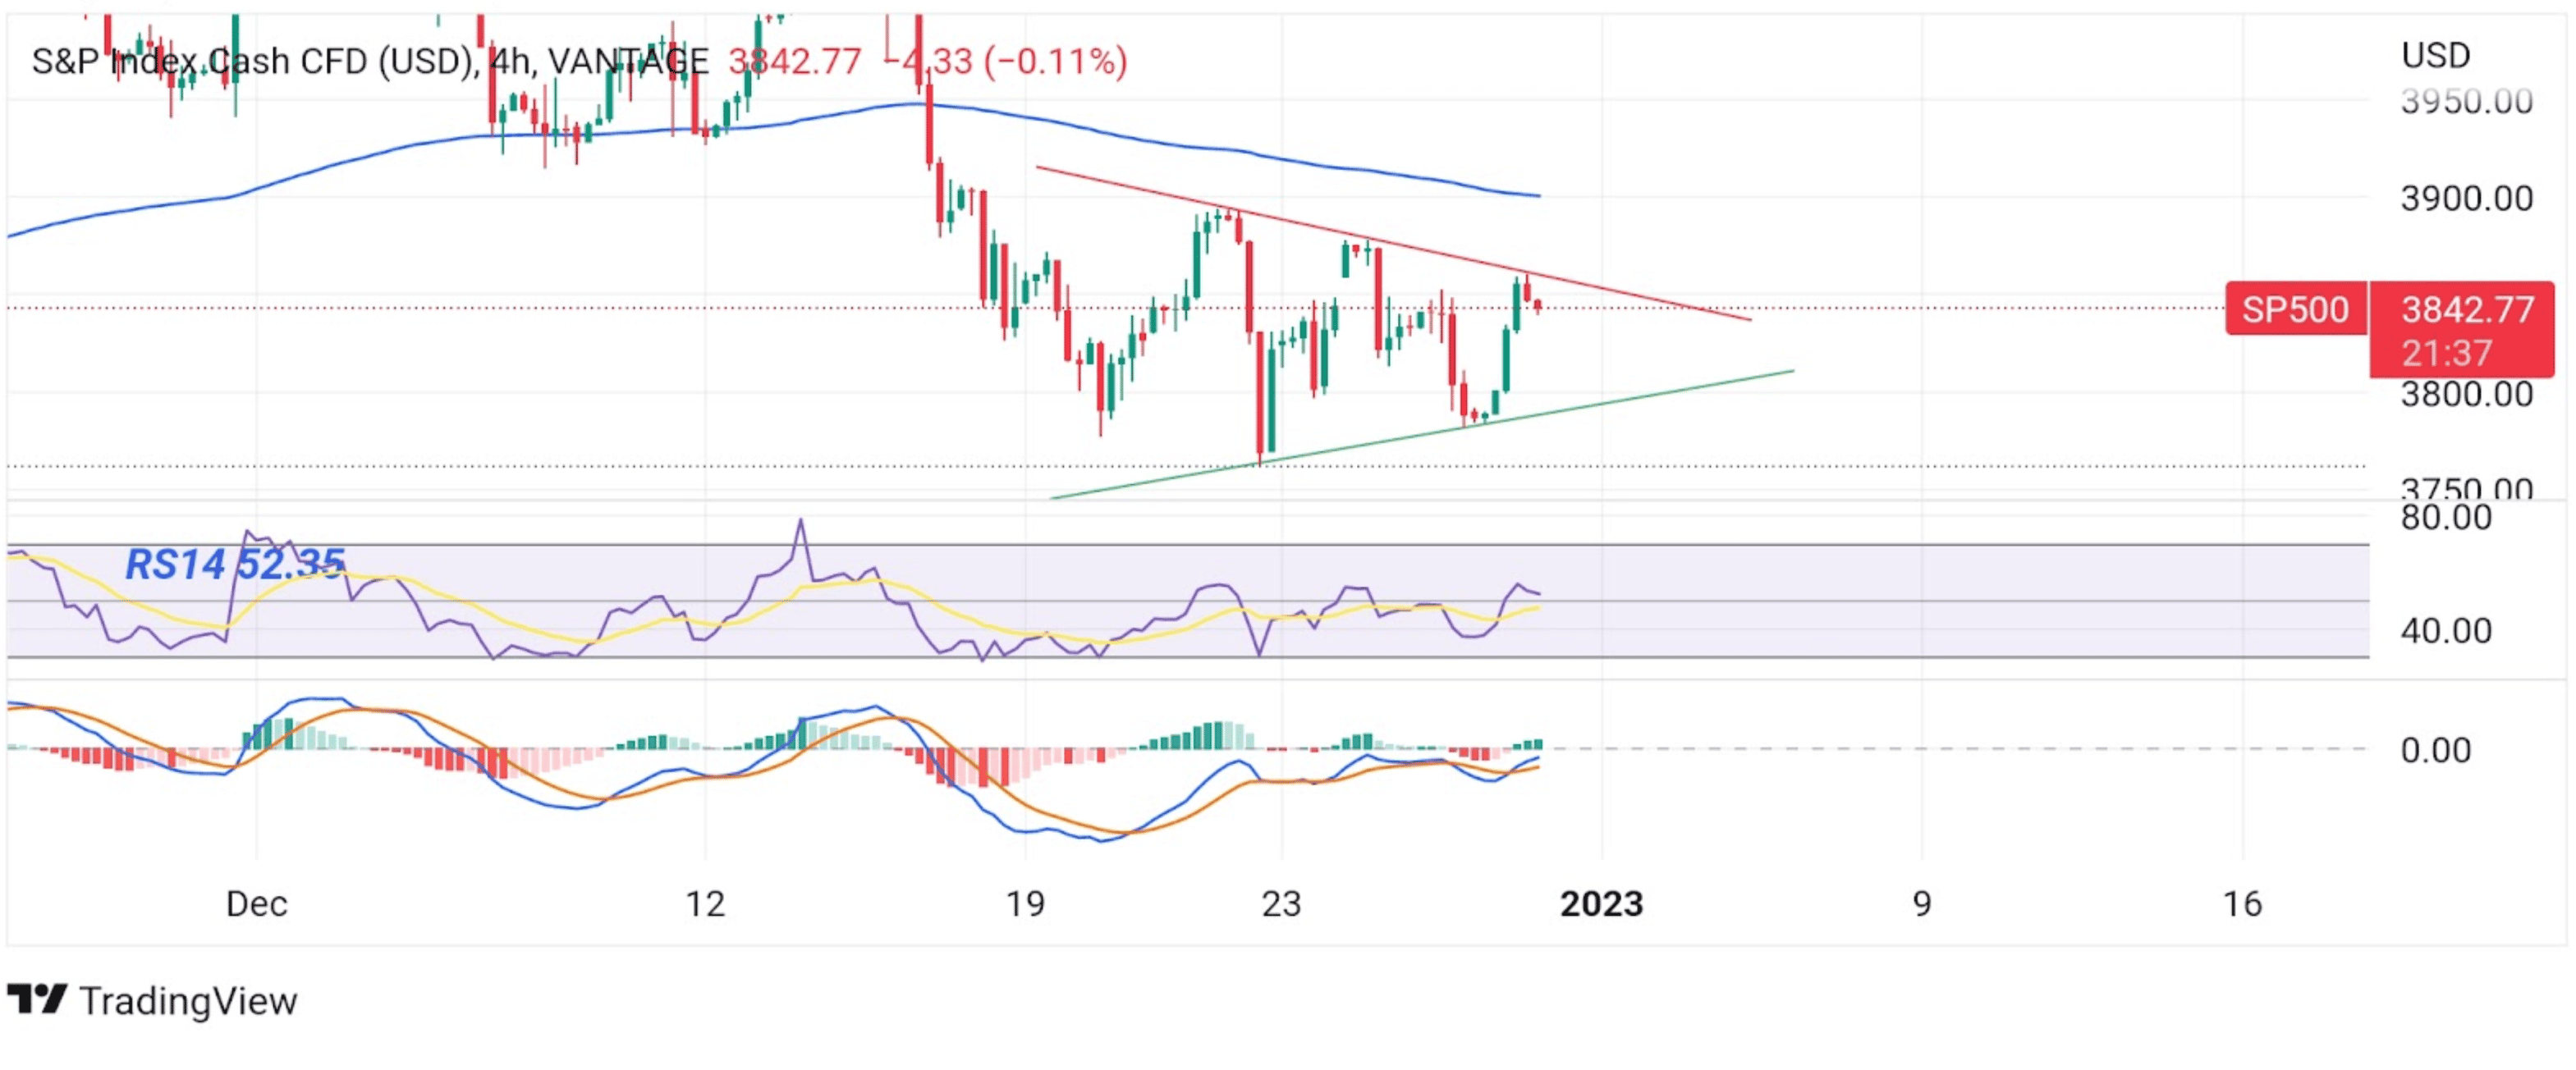
From a technical standstill, the price has extended the modest rebound from the vicinity of the 3859.95 level after a firm rejection from the key resistance level plotted by a downward-sloping trend-line of the Bearish Pennant Chart Pattern extending from the Dec. 22, 2022, Higher-highs. Some follow-through selling would drag spot prices lower toward the key support level plotted by an upward trend-line of the Bearish Pennant Chart Pattern extending from the Dec. 22, 2022, Lower-lows. Sustained weakness below the aforementioned barrier (bearish Price breakout) would negate any near-term bullish outlook and pave the way for aggressive technical selling around the S&P 500 Index Futures.
The RSI (14) level at 52.35 is above the signal line, portraying a bullish filter. However, traders should wait for near-term consolidation before placing new bearish bets. On the other hand, the moving average convergence divergence (MACD) is below the signal line, pointing to a bearish sign for price action this week and adding credence to the downside bias.
On the Flipside, if dip-buyers and tactical traders jump back in and trigger a bullish turnaround, initial resistance appears at the 3847.49 resistance level en route to the key resistance level plotted by a downward-sloping trendline of the Bearish Pennant Chart Pattern. If the price pierces these barriers (including a bullish price breakout), buying pressure could gain momentum, paving the way for aggressive technical buying. The Bullish trajectory could then accelerate towards the key supply zone ranging from 3890.93 - 3899.50 (the latter coincides with the strong 200 Exponential Moving Average). Sustained strength above this barrier would pave the way for additional gains around the S&P 500 Futures Index.