3 Bearish Candlestick Patterns You Should Know


Key Takeaways:
- Bearish Candlestick patterns are usually formed at the end of an uptrend to signify a potential reversal to the downside
- Bearish engulfing, gravestone doji, and shooting star are three bearish candlestick patterns that are important to know for traders and investors
- Bearish candlestick patterns should be combined with indicators and tools to determine high-probability trade signals
In technical analysis, candlestick patterns predict market trends and price reversals. Among the plethora of candlestick patterns, there are three bearish patterns that every trader should be familiar with. These patterns, known as the bearish engulfing, Gravestone Doji, and the shooting star, offer valuable insights into potential downturns in the market. By identifying and understanding these patterns, traders can effectively anticipate and capitalize on bearish trends. Get ready to enhance your trading toolkit and take your skills to the next level with these essential bearish candlestick patterns.
Bearish Engulfing
- A Potential trend reversal from bullish to bearish.
A bearish engulfing candlestick pattern is recognized by two candles, typically found at the end of an uptrend. The first candle in a bearish engulfing pattern is bullish, opening and closing higher than the previous candle. The second candle, however, is bearish and engulfs the entire body of the last candle, indicating a potential reversal (bullish to bearish)in the market sentiment.
The bearish engulfing pattern is formed when selling pressure overwhelms buying pressure, causing the market to reverse. It signifies a shift in investor sentiment from buying to selling as the bears take control and lower the price. This pattern is precious because it provides traders with a clear visual representation of a potential change in market direction. It can be a powerful indication for those looking to time their entry or exit points in the market.
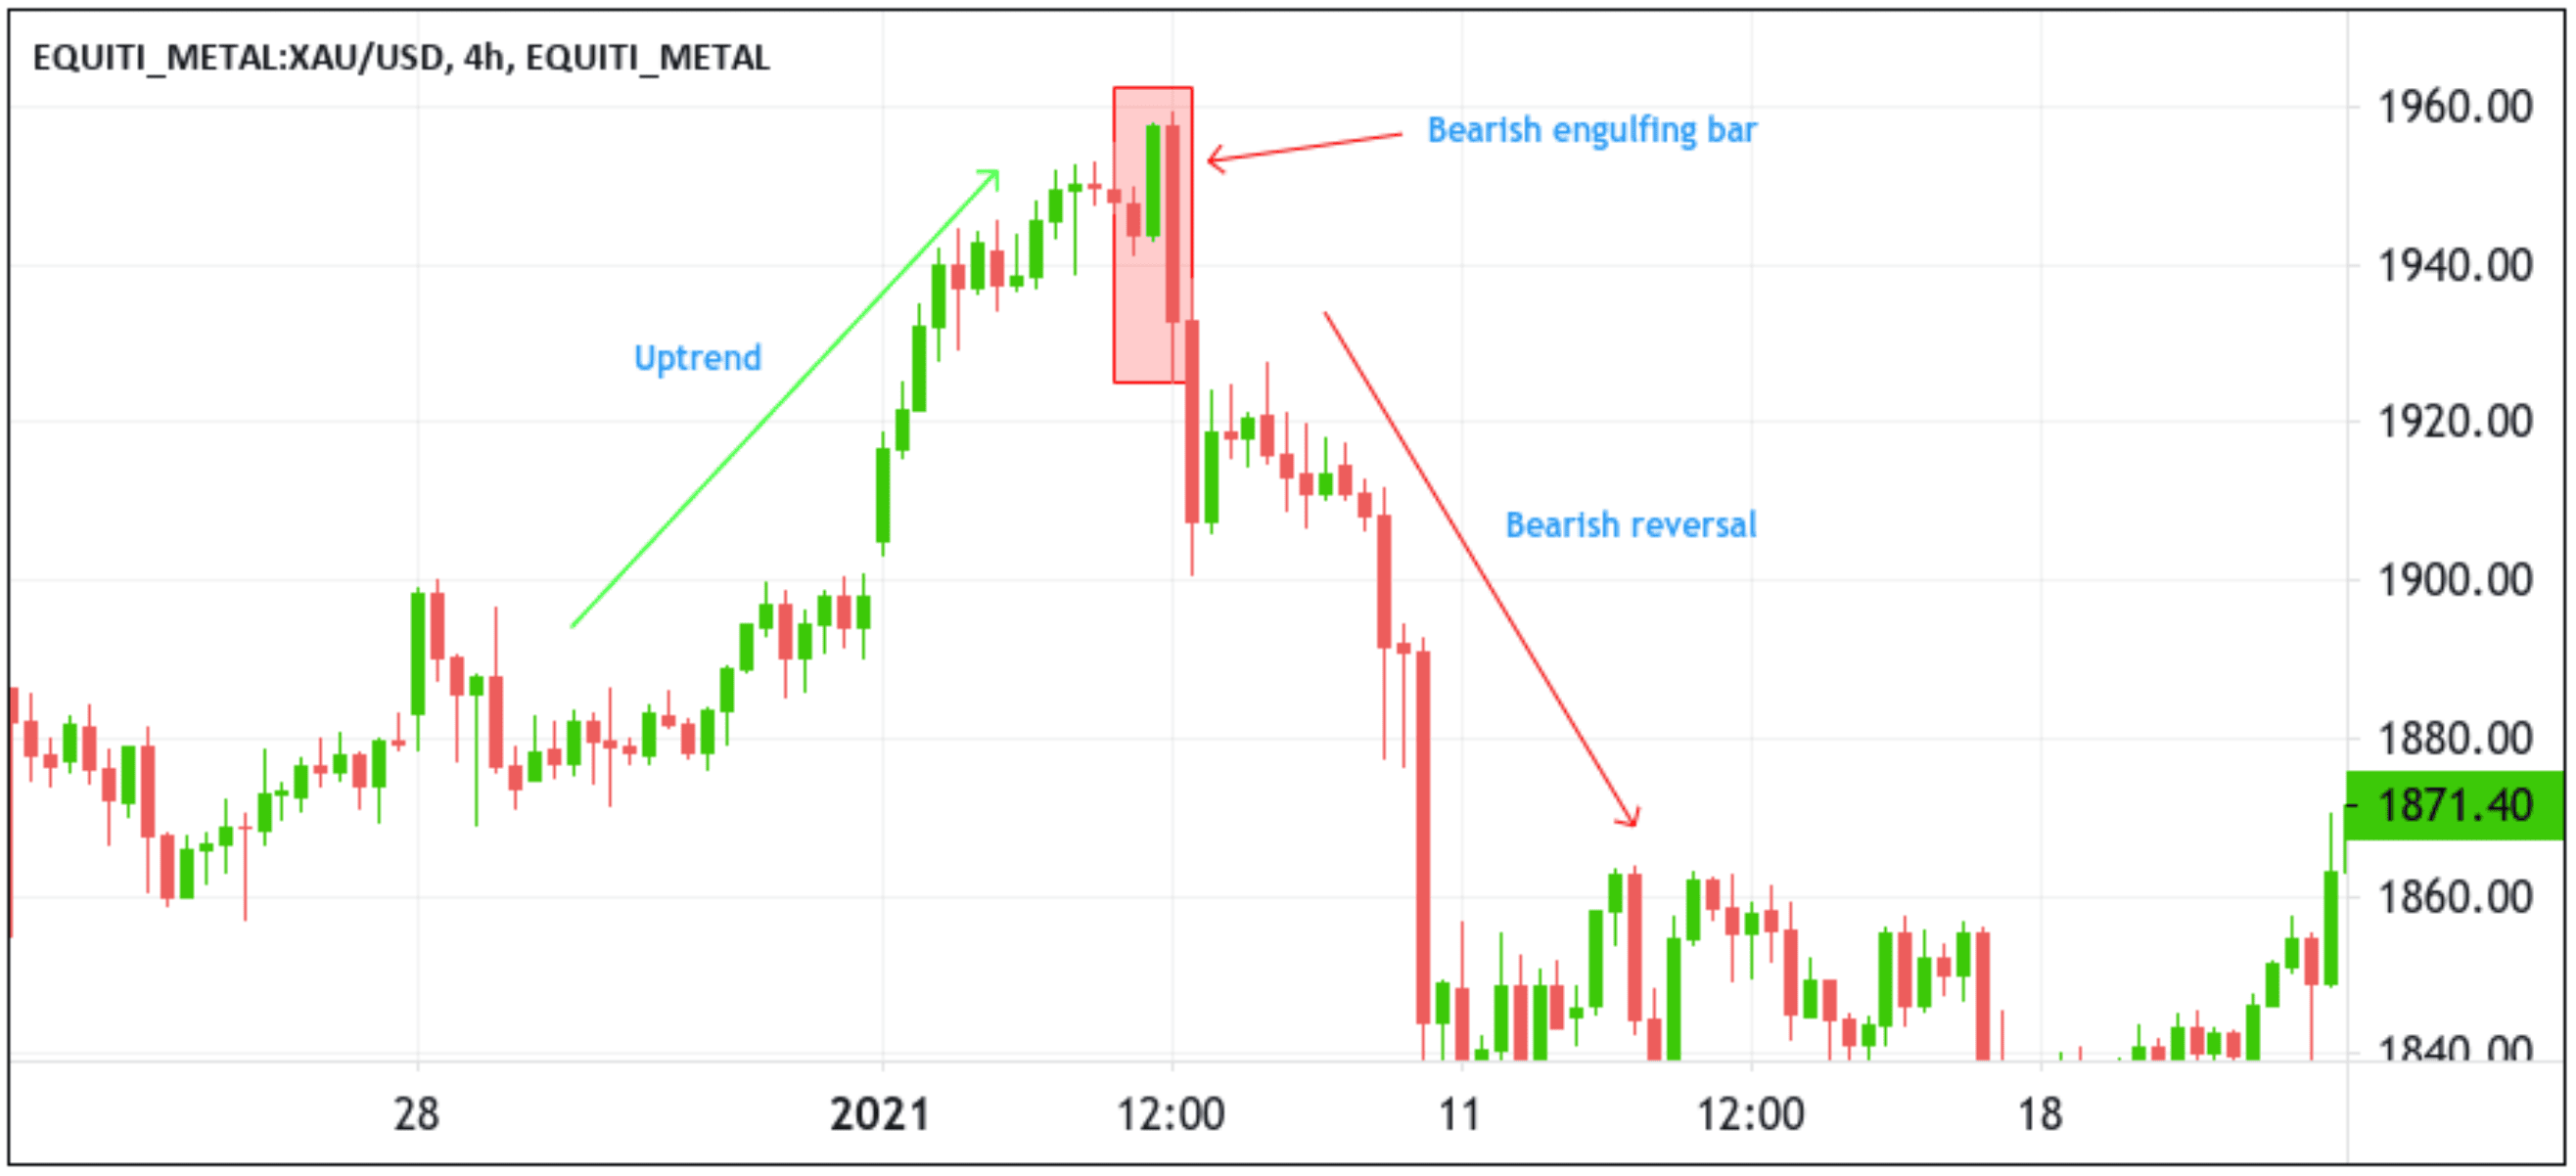
For instance, as you can see in the one-day gold chart above when this price action pattern occurs in an uptrend, we can anticipate a trend reversal because buyers are not still in control of the market, and sellers are trying to push the market down.
💡Tips: You can't trade any bearish candlestick pattern you find on your chart; you will need other technical tools to confirm your entries.
Gravestone Doji
- A Potential bearishness as sellers pushed the price down from its highs.
The gravestone doji is a bearish candlestick pattern formed when the open and close are the same or about the same price and is characterized by a long upper shadow (long tail), a small natural body, and a little or no lower shadow near the lower end of the candlestick. Visually, it resembles an upside-down capital "T" or a gravestone, which is how it gets its name. The length of the upper shadow represents the highest price reached during the period under analysis, while the small natural body indicates relatively limited price movement between the open and close.
This formation suggests that despite initial optimism and potential bullish sentiment, sellers ultimately managed to push the price back down to near its opening level, leaving a bearish impression. Gravestone Doji can indicate potential trend reversals or significant resistance levels, making it a crucial candlestick pattern for technical traders to monitor and adjust their strategies accordingly. For this pattern to be reliable, it must occur near a resistance level.
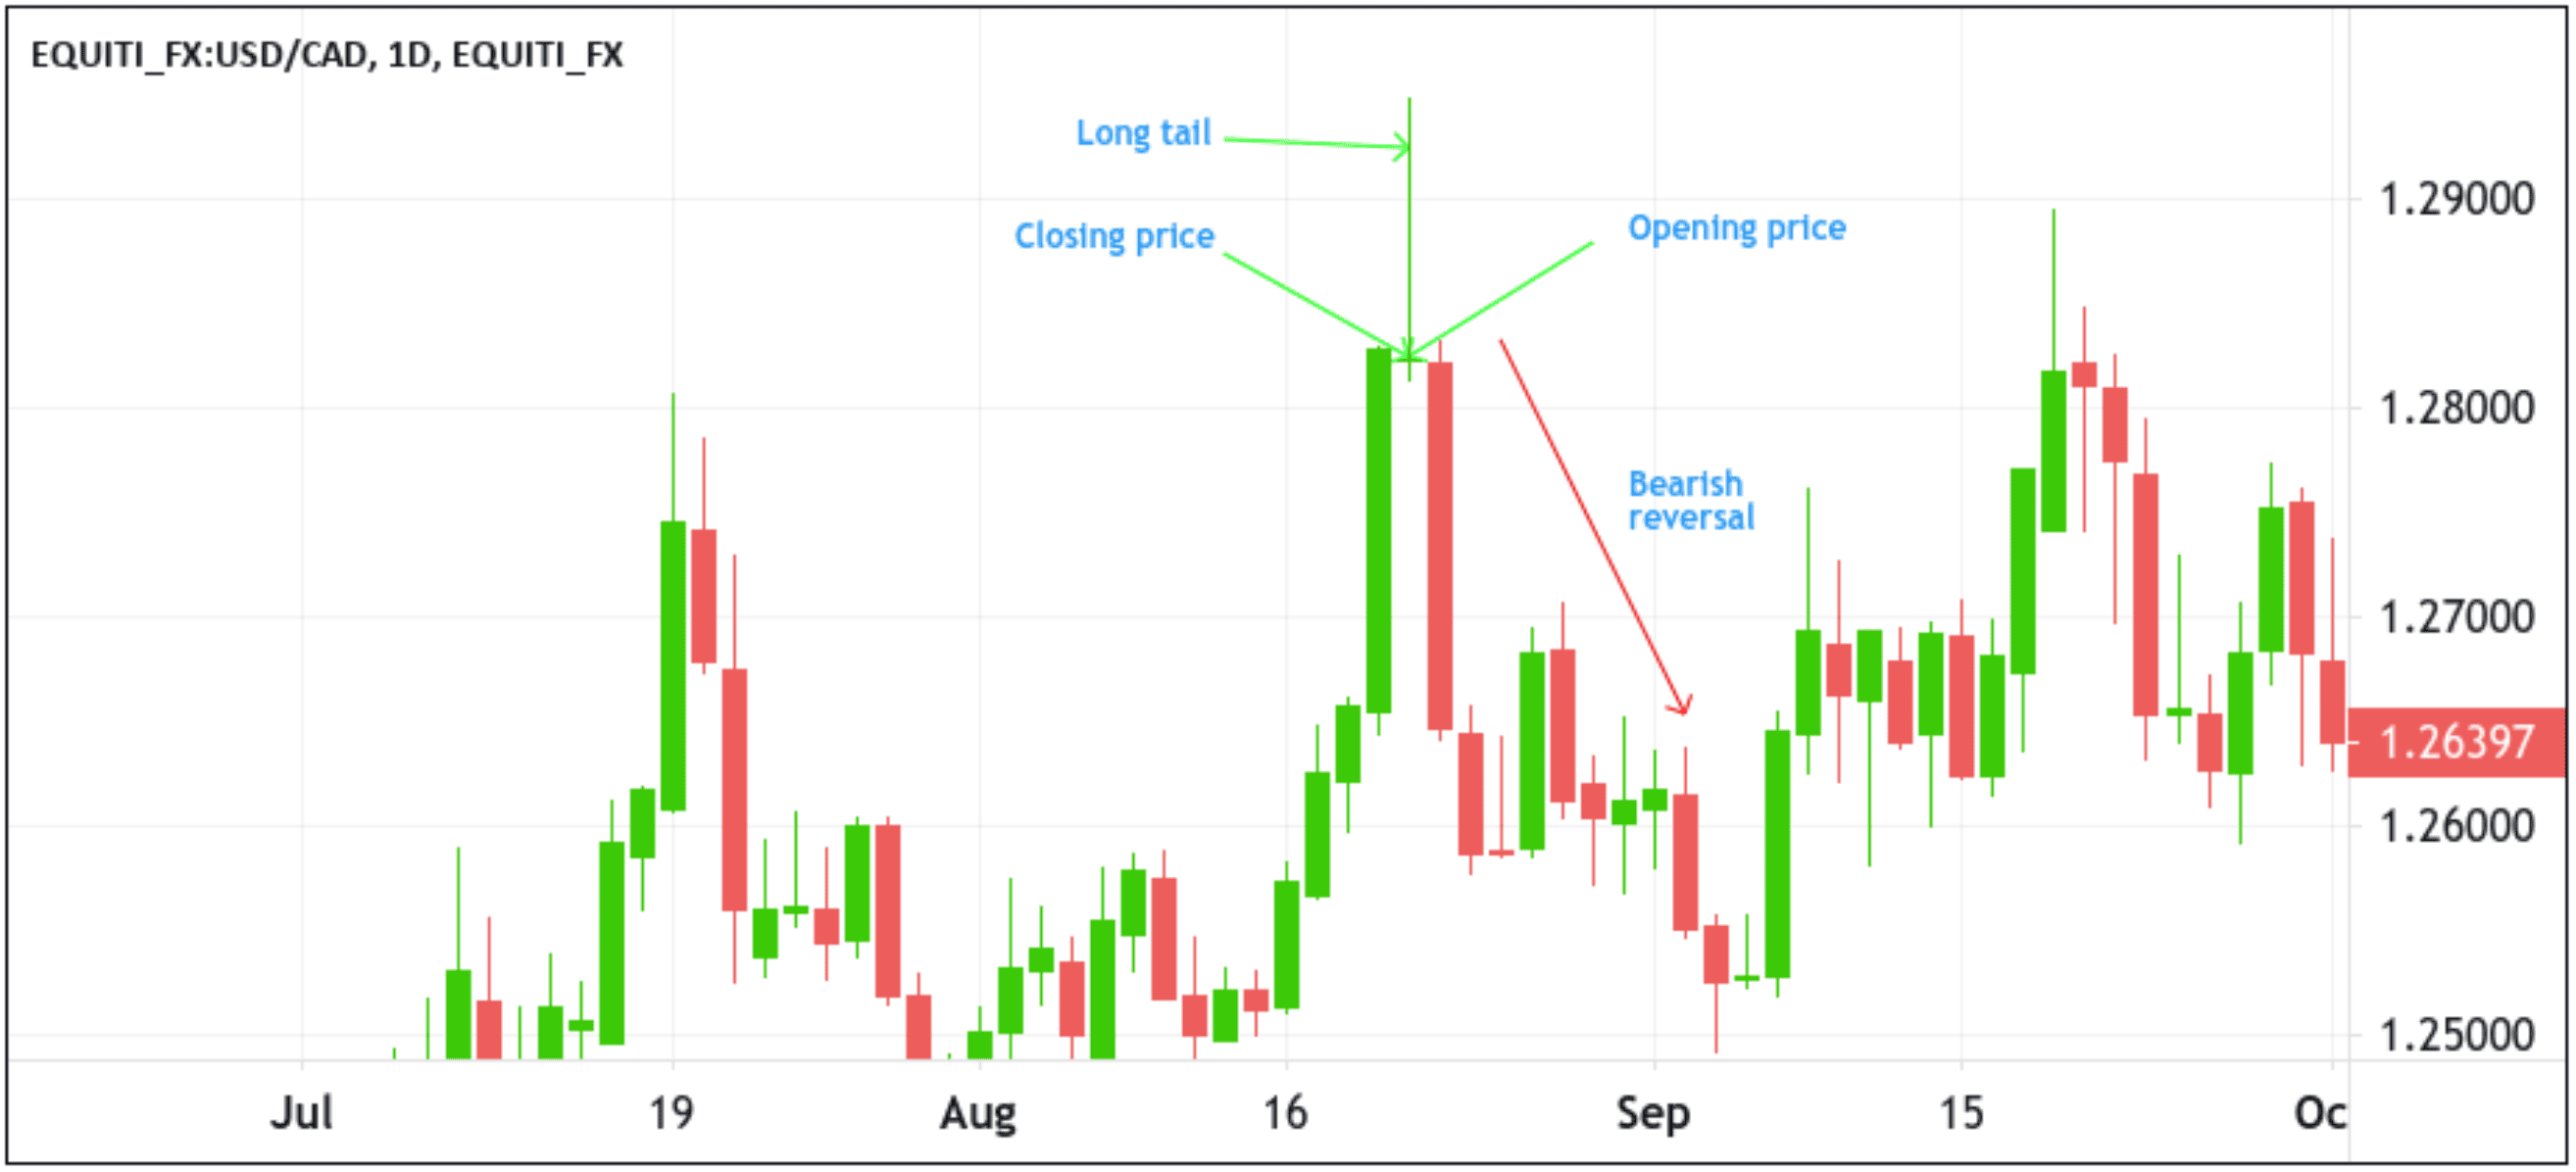
For instance, the one-day USD/CAD chart above shows a gravestone Doji at the top of an uptrend after a period of bullish solid activity. After that, we see the price reversing and falling almost 325 pips before consolidating.
💡Tips: The coloration of the doji candlestick can vary depending on your trading platform. While some platforms may display the doji stick in traditional black or white, others may present it in colors such as green or red. This discrepancy can confuse especially if you are accustomed to a specific color scheme. You must be aware of this variation so that you can adapt your strategies accordingly, focusing on the pattern itself rather than a particular color.
Shooting Star
- A Potential bearishness as sellers pushed the price down from its highs.
A shooting star candlestick chart pattern is formed when the open, low, and close are roughly the same price and is characterized by a small body and a long wick extending upward, resembling a shooting star. This pattern typically occurs after a bullish trend, signalling a potential reversal in the market. When observed on a price chart, the shooting star pattern suggests a shift in sentiment from buyers to sellers. The small body represents a brief period of consolidation, while the long wick indicates that sellers have pushed the price down significantly before a potential bounce back. Traders typically look for confirmation signals, such as a bearish candle or a drop in trading volume, to validate this pattern. 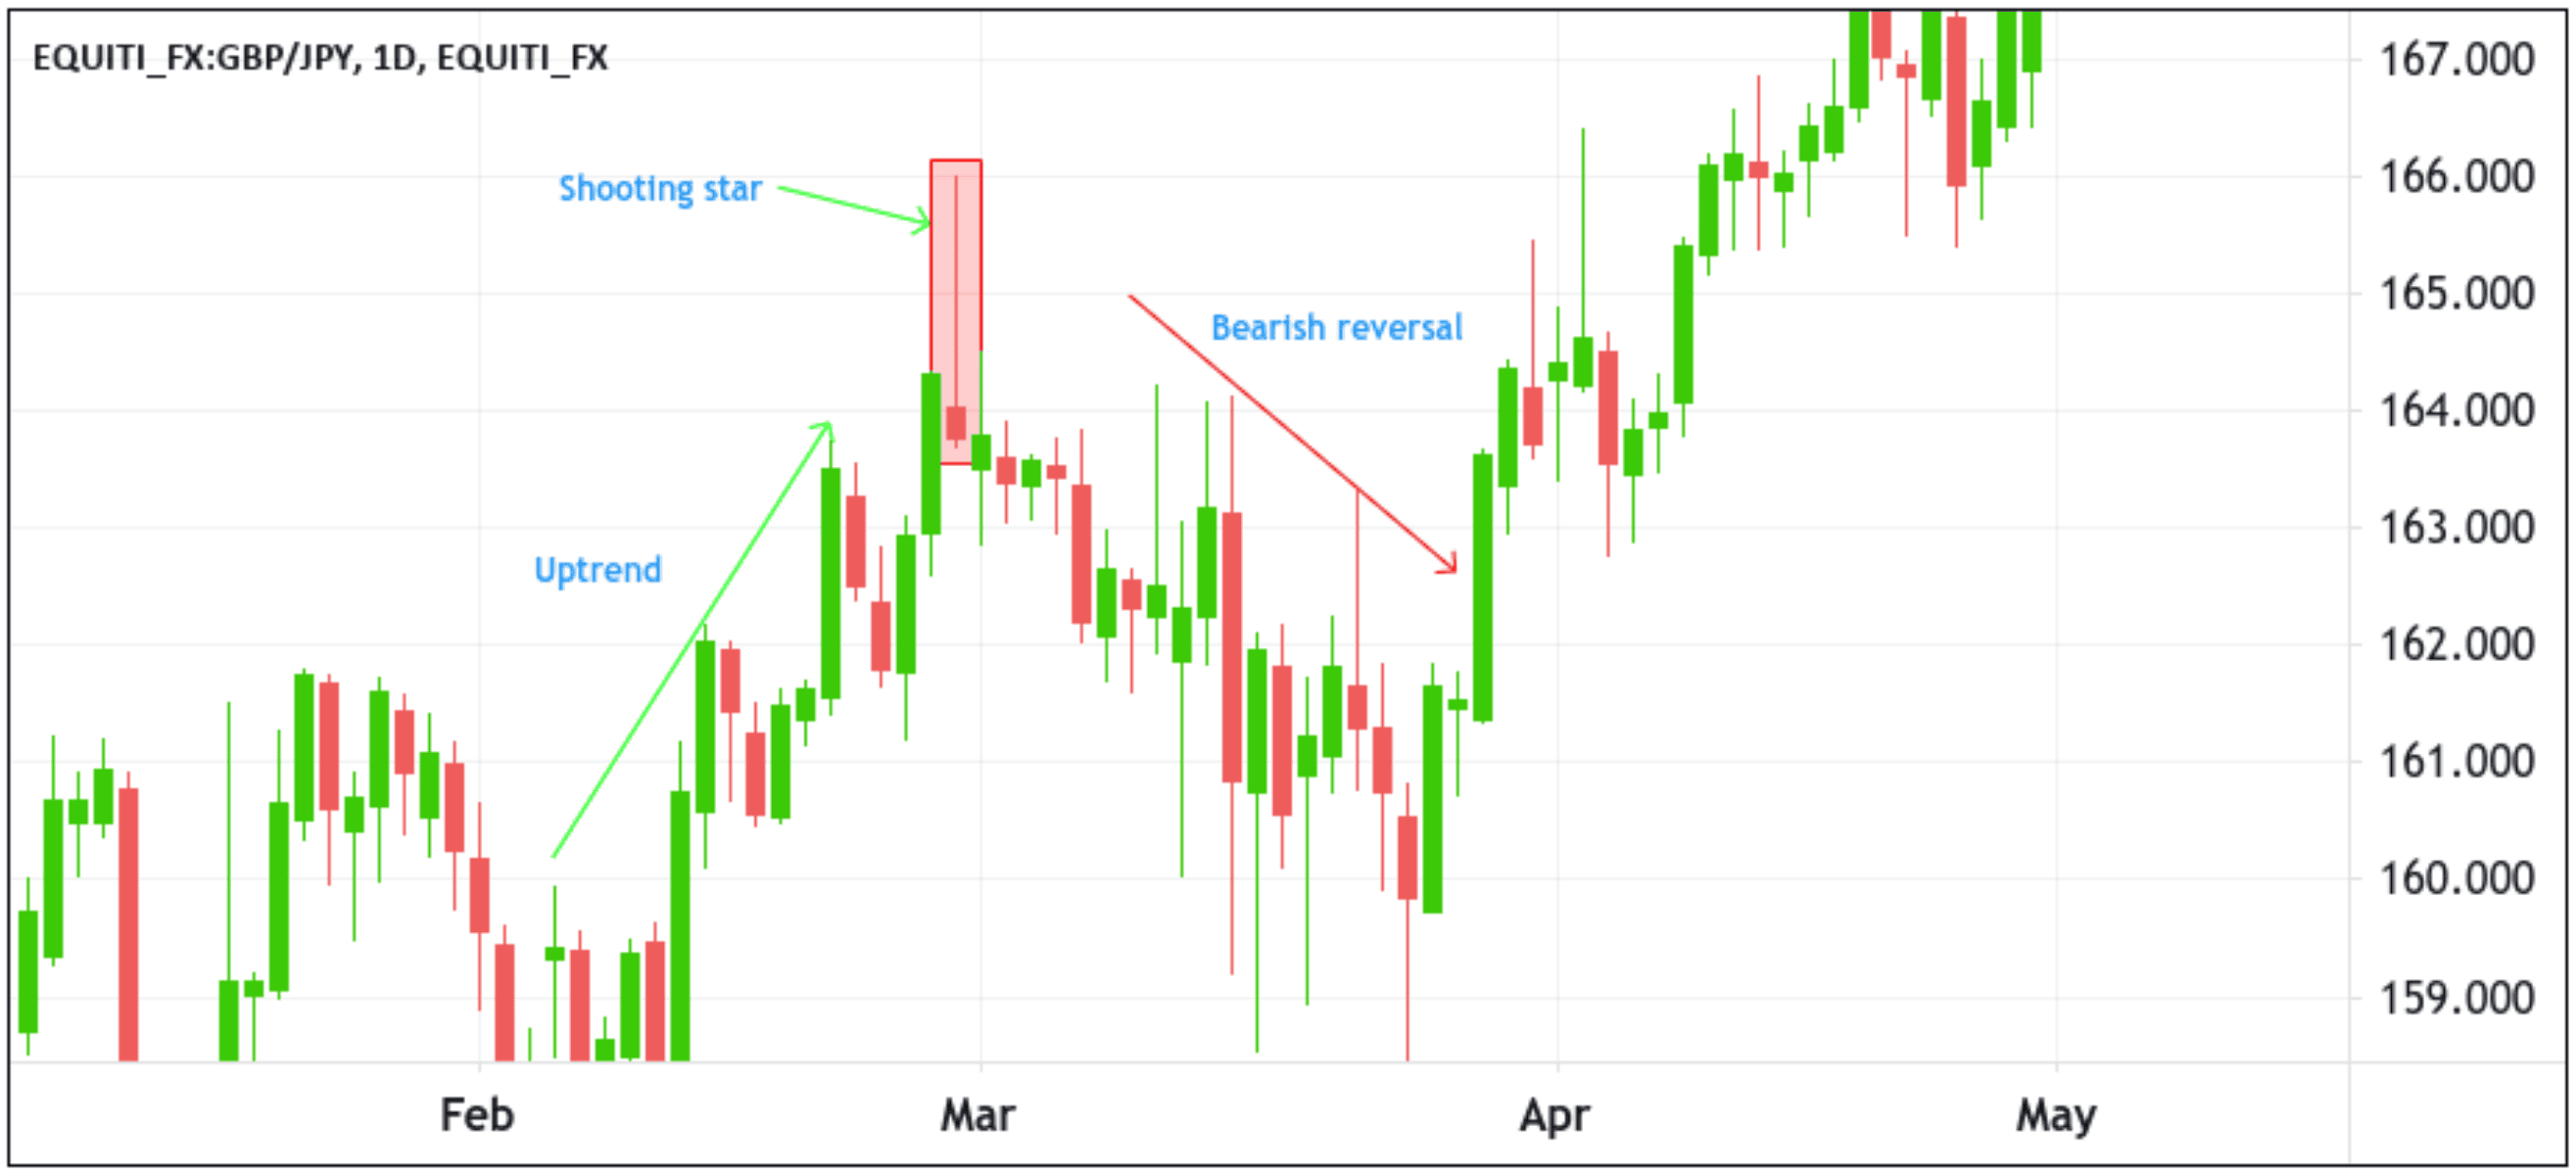
For instance, the one-day GBPJPY chart above shows a lovely shooting star at the end of an uptrend (the rally from 3rd February to 27th February 2023). After that, the market slows, causing the GBP/JPY price to fall by as much as 200 pips before consolidating.
Conclusion
In conclusion, by considering these patterns in conjunction with other technical indicators and market conditions is essential to validate their reliability. By studying and familiarizing oneself with these candlestick patterns, traders can enhance their trading strategies and improve their chances of making profitable trades.

Are you looking to start investing? You can Enjoy FREE USD 10,000 Virtual Funds for support by Signing Up on Pocket Trader. With Pocket Trader, You can invest in multiple markets, including forex and commodities, learn from experienced traders and share ideas with their social features to build wealth together.