3 Bullish Candlestick Patterns You Should Know


Key Takeaways:
- Bullish candlestick patterns are usually formed at the end of a downtrend to signify a potential reversal to the upside
- Bullish engulfing, Dragon Fly doji, and Hammer are three bullish candlestick patterns that are important to know for traders and investors
- Bullish candlestick patterns should not be used in isolation but in conjunction with other technical indicators and analysis tools to determine high-probability trade signals
After knowing some of the most popular bearish candlesticks pattern, this article will explore three bullish candlestick patterns that every investor should know. These patterns, known for their upward trend predictions, include the bullish engulfing bar, the Dragonfly Doji, and the Hammer. By familiarizing yourself with these patterns, you can enhance your trading strategy and increase your chances of making profitable decisions. So, let's dive in and uncover the secrets behind these powerful candlestick patterns.
Bullish Engulfing
- A Potential trend reversal from bearish to bullish.
A bullish, engulfing candlestick pattern is recognized by the presence of two candles, typically found at the end of a downtrend. The first candle in a bullish engulfing pattern is bearish, opening and closing lower than the previous candle. The second candle, however, is bullish and engulfs the entire body of the last candle, indicating a potential reversal (bearish to bullish) in the market sentiment.
The bullish engulfing candlestick signifies that bulls (buyers) have gained control over the market and are overpowering the bears (sellers). When a bullish engulfing candle forms at the end of a downtrend, the reversal is much more powerful as it represents a capitulation bottom. The size and strength of the engulfing candlestick are key indicators of the intensity of the reversal.
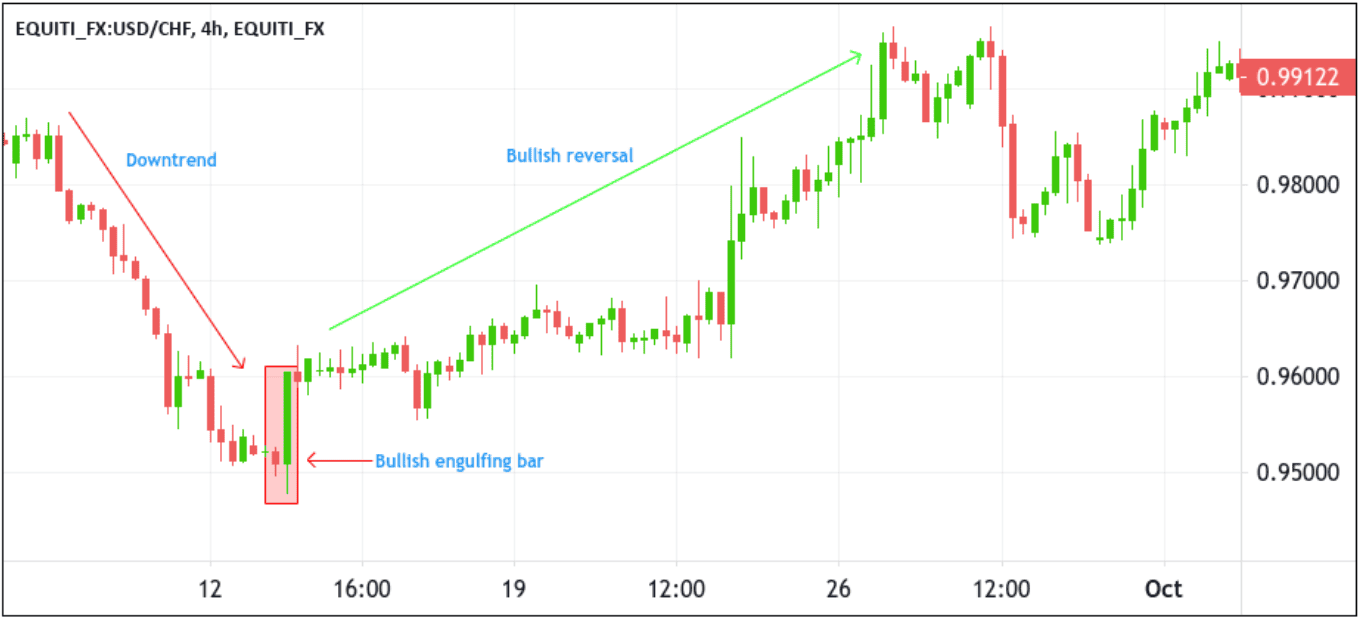
For instance, as you can see in the four-hour USD/CHF chart above, the market was trending downward, but after forming a bullish engulfing bar pattern, the market changed direction and started moving upwards.
💡Tips: Before making any trading decisions, it is essential to consider other factors and use different technical indicators to confirm the validity of the bullish engulfing pattern.
Dragonfly Doji
- A Potential bullishness as buyers pushed the price up from its lows.
The Dragonfly Doji is a bullish candlestick pattern formed when the open, high, and close are the same or about the same price and is characterized by a single candlestick with a long lower shadow and little or no upper shadow, resembling a dragonfly's body with outstretched wings. This pattern indicates that there was significant selling pressure during the trading session, driving the price down before buyers stepped in and pushed it back up to close near the session's high. The dragonfly doji suggests a shift from a bearish to a bullish trend, highlighting the possibility of a trend reversal or a temporary halt in the current downtrend. Traders often use it to signal to enter long positions or close out short positions and take profits. However, it is essential to consider other technical indicators and market conditions when interpreting the dragonfly doji, as its reliability depends on the context in which it appears.
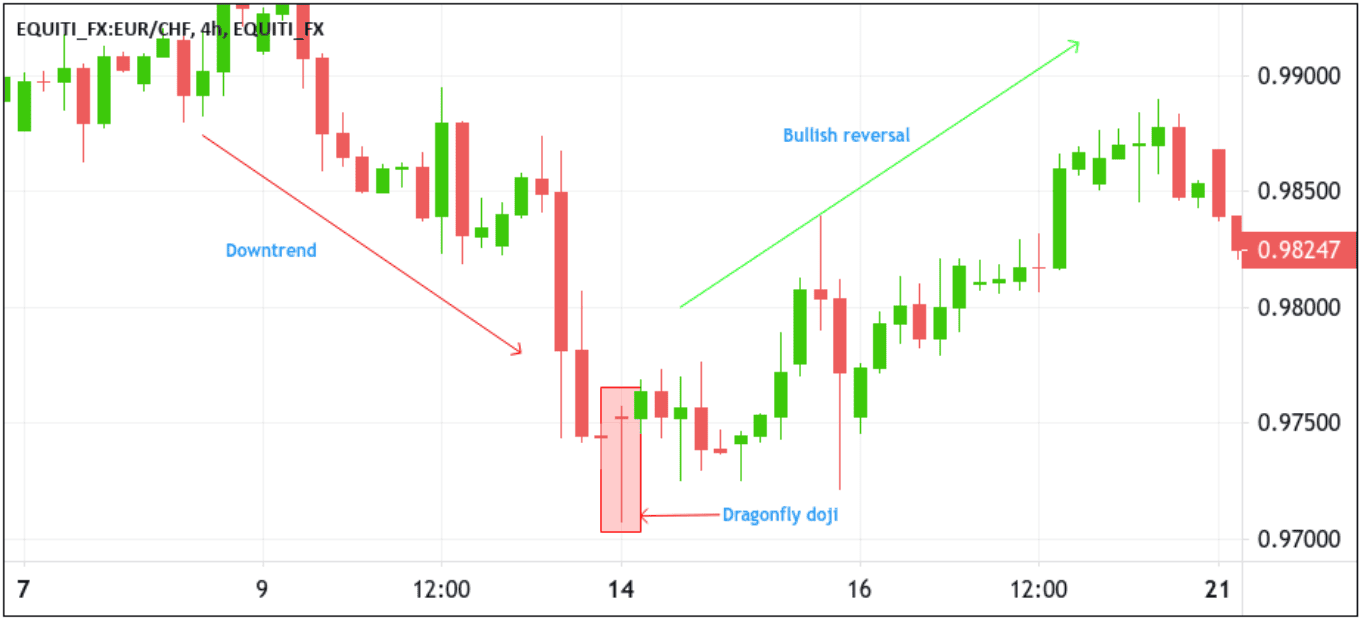
For instance, in the four-hour EUR/CHF chart above, the market was testing the previous support level, which caused a strong rejection from this area. After that, bulls push the market, causing the EUR/CHF price to rise by almost 127 pips before consolidating.
💡Tips: The colouration of the doji candlestick can vary depending on the trading platform you are using. While some platforms may display the doji stick in traditional black or white, others may present it in colors such as green or red. This discrepancy can confuse you, mainly if you are accustomed to a specific color scheme. You must be aware of this variation so that you can adapt your strategies accordingly, focusing on the pattern itself rather than a particular color.
Hammer
- Buyers have pushed the price up, suggesting a potential bullish reversal.
A hammer candlestick, also known as a pin bar, is a bullish reversal pattern created when the open high and close are roughly the same price; it is also characterized by a long lower shadow that indicates a bullish rejection from buyers and their intention to push the market higher.
This candle forms when sellers push the market lower after the opening but are rejected by buyers, so the market closes higher than the lowest price. This pattern is compelling when it forms near significant support levels, indicating a more substantial likelihood of a bullish move.
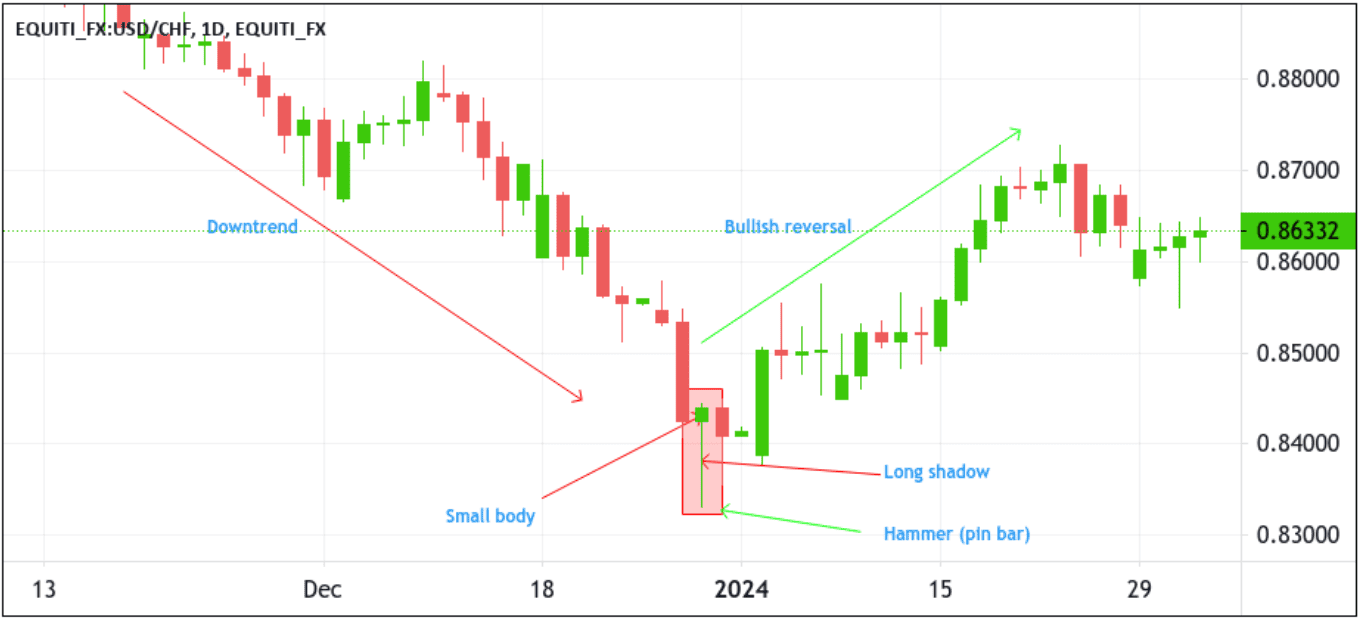
As you can see in the one-day USD/CHF chart above, the market was trending down, and the Hammer (pin bar) formation was a significant reversal pattern.
In the real sense, sellers were trying to push the market lower, but at that level, the buying power was more powerful than the selling pressure, which resulted in a trend reversal.
Conclusion
In conclusion, understanding and recognizing bullish candlestick patterns is a valuable skill for any trader or investor. The three patterns discussed in this article - the Bullish Engulfing Pattern, Dragonfly Doji, and the Hammer - all provide necessary signals of potential market reversals or upward trends. By carefully studying these patterns and their corresponding formations, traders can gain a deeper insight into market sentiment and make informed investment decisions. However, it is crucial to remember that candlestick patterns should not be used in isolation but in conjunction with other technical indicators and analysis tools. Additionally, it is equally important to manage risk and set realistic profit targets. With practice and experience, traders can harness the power of bullish candlestick patterns to enhance their trading strategies and potentially achieve profitable outcomes.
Looking to grow your wealth through social trading? Look no further than Pocket Trader! With Pocket Trader, you can connect with other traders, learn from experienced investors, and share your own insights with the community! Trade wiser now.