Gold Bounces Off From Monthly Low And Retakes Early $2000.0s, Upside Potential Seems Limited


Key Takeaways:
- Gold traded with mildly bullish bias on Thursday, supported by a combination of factors
- Uncertainty over the Federal Reserve's (Fed) rate trajectory and the ongoing war in the Middle East act as a tailwind to the commodity
- The hawkish Fed commentary, fresh, positive U.S. macro data, and the fresh batch of disappointing Chinese macro data lend support to the buck and might help limit further gold gains
- A slew of key U.S. macro data is set to be released today and will help determine the next leg of a directional move for gold prices
Gold witnessed some selling during the mid-Asian session on Thursday and reversed the previous day's modest bounce from the $2001.62 level, or a five-week low, but is currently trading at $2007.09, still 0.09% up for the day.
Uncertainty over the Federal Reserve's (Fed) rate trajectory is a key factor weighing on Treasury bond yields, undermining the safe-haven buck and helping drive flows toward the non-yielding yellow metal. This comes on the back of mixed U.S. BLS reports released last week, which showed. Consumer inflation in the U.S. rose slightly to 0.3% last month, while wholesale inflation dropped slightly to 0.%, fueling speculations about Fed rate cuts.
However, markets feel the Fed will backtrack on its pledge to start cutting rates as early as March, as initially expected. This comes after the last few days have seen influential FOMC members double down on pushing back on early rate cuts, with most members preferring rate cuts to start mid-this year.

CME's Fed Watch tool shows that Fed Fund futures traders have slashed their odds of a 25 basis point rate cut in March from 70.0% early this week to 59.5% as of press time. That said, the hawkish Fed commentary remains supportive of Treasury bond yields, which continue to support the greenback and might help limit further gains around the precious commodity. Apart from this, the buck continues to draw support from firmer U.S. retail sales figures for December, which stood at 0.6% month-over-month following a 0.3% rise in November and beating forecasts of 0.4%. Excluding autos, gas, building materials and food services, the so-called core retail sales rose at a strong 0.8%, the most since July.
Additionally, a fresh batch of disappointing data from China, the world's top gold producer, continues to act as a headwind to the yellow metal and might help cap the upside for the XAU/USD cross. A Chinese Bureau of National Statistics (NBS) report released on Wednesday showed the Chinese economy expanded 5.2% year over year in Q4 of 2023, faster than a 4.9% growth in Q3 but less than market forecasts of 5.3%.
The Chinese GDP report joins last week's disappointing NBS report, which showed consumer prices in China remained in deflationary territory for the third straight month in December. The downbeat mood saw a jump in industrial production last month greatly overshadowed.
Despite the aforementioned supportive factors, gold continues to draw support from the ongoing war in the Middle East. Any further escalation of the war would lead to an increased appetite for safe-haven assets, which would benefit the dollar-denominated commodity.
As we advance, investors look forward to the release of the Philadelphia Fed Manufacturing Index (Jan), the Initial Jobless Claims (previous week), and the preliminary Building Permits (Dec) data reports. The data would influence the USD price dynamics, which, along with the broader market risk sentiment, should allow traders to grab some trading opportunities around gold.
Technical Outlook: Four-Hours Gold Price Chart
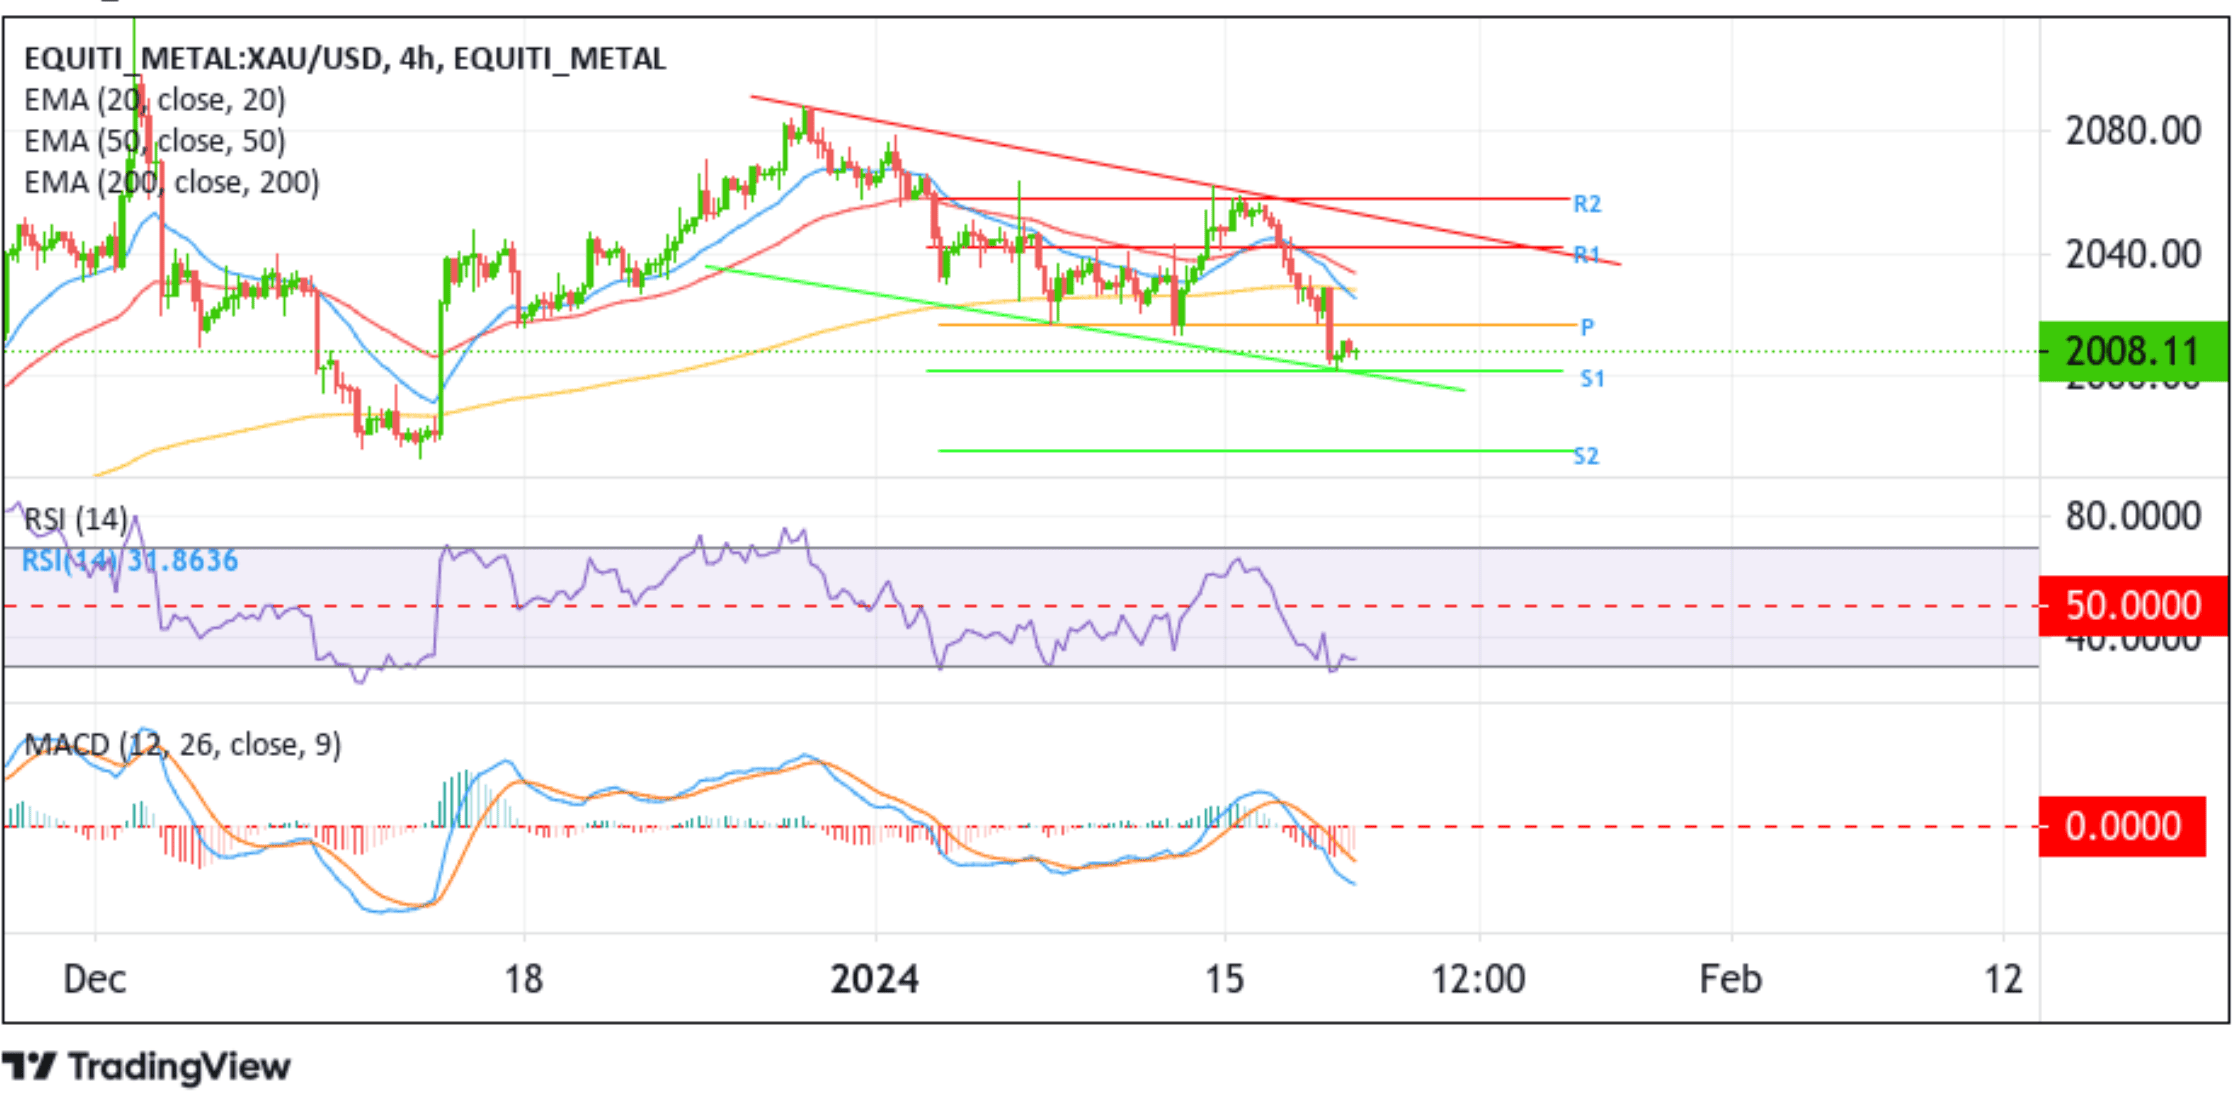
From a technical perspective, the metal's inability to capitalize on the move above the $2012.00 level favors bearish traders. A further increase in selling momentum in the coming sessions will drag spot prices toward the $2001.76 horizontal support. A clean move below this level, followed by a break below the lower limit of the descending channel pattern, will reaffirm the negative bias and pave the way for additional losses. Gold prices could then accelerate the fall toward the support level at $1975.63 (S2) en route to the $1956.18 level.
On the flip side, the $2017.04 pivot level (p) now is an immediate hurdle. Sustained strength above this level could see gold extend its bullish pullback toward tagging the 20-day (blue) EMA level, currently at $2025.36. Some follow-through buying would pave the way toward the important 200-day EMA, currently at $2029.36. A convincing move above this level will negate the current bearish outlook and pave the way for a rally toward the 50-day (red) EMA level, currently at $2033.72, followed by $2042.15 (R1), and in highly bullish cases, gold could extend a leg up toward the upper limit of the descending channel pattern.