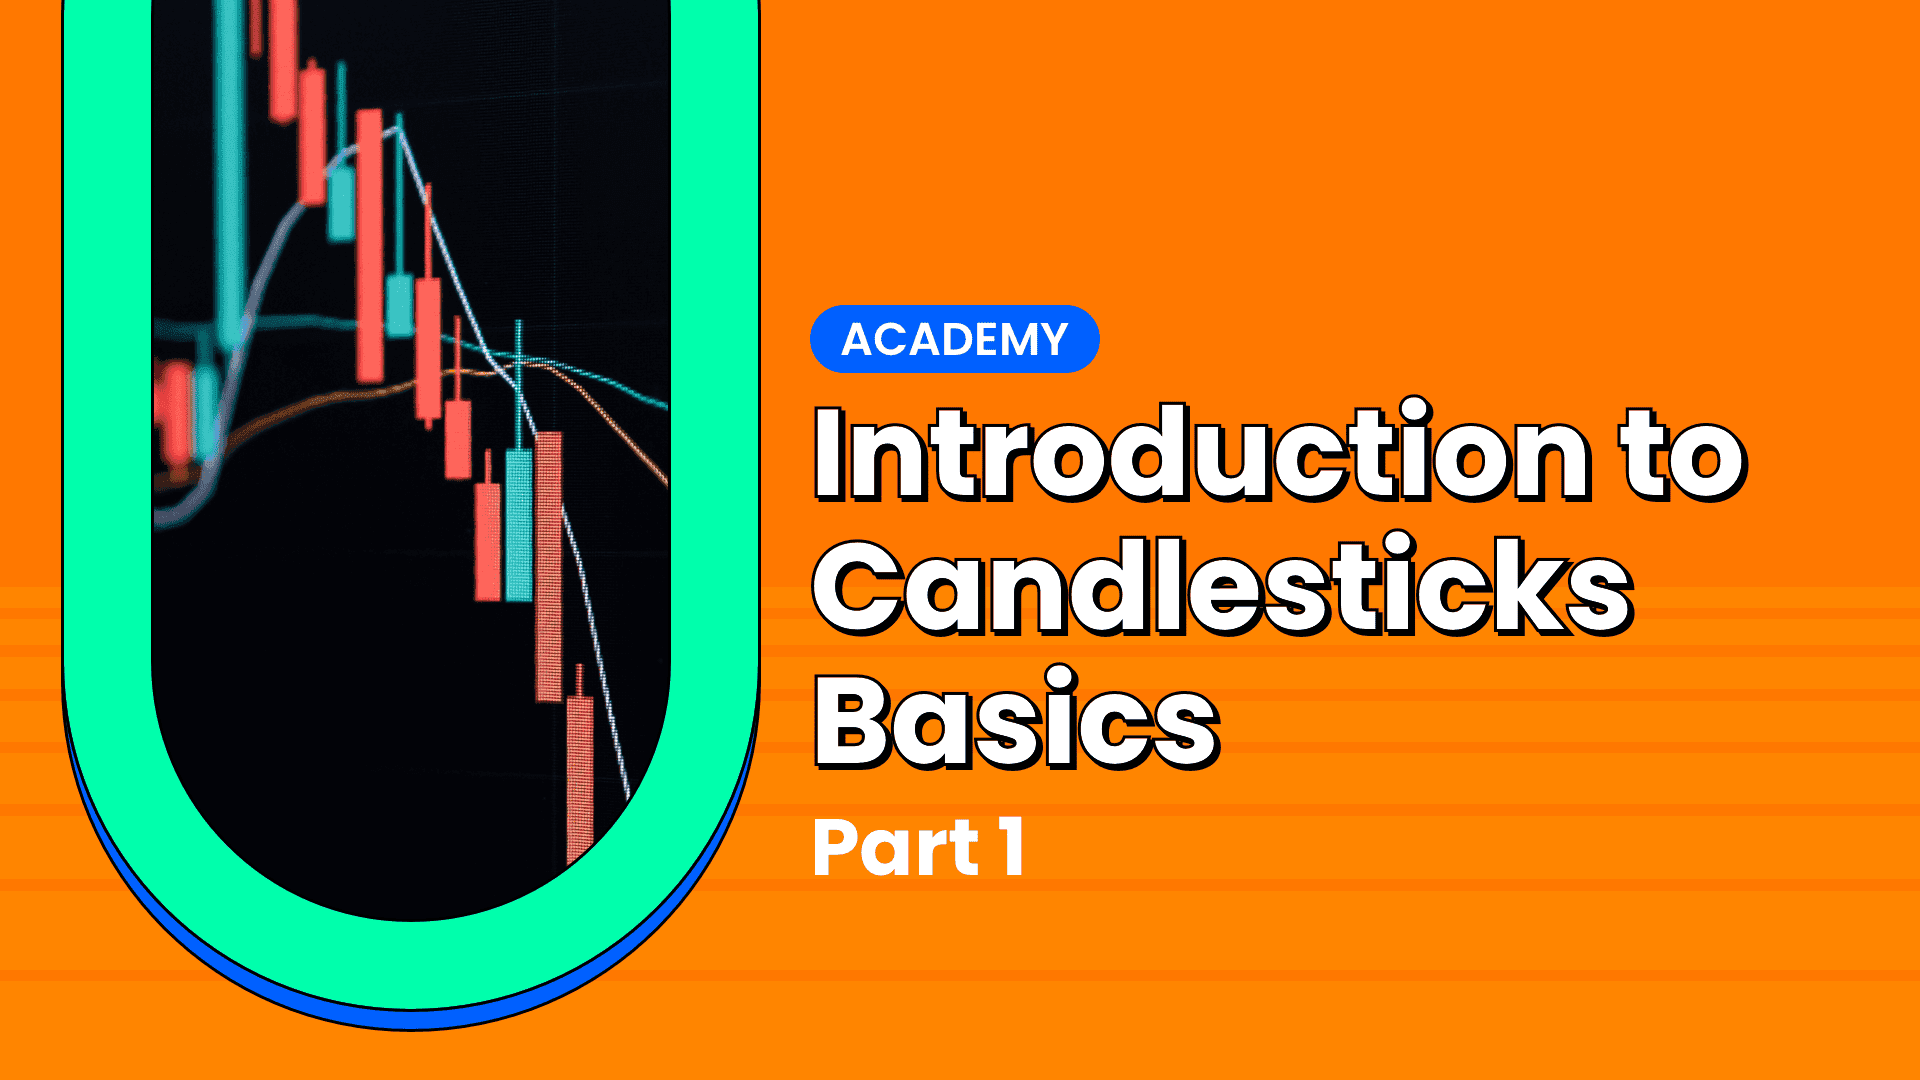
Introduction To Candlesticks Basics (Part 2)


Candlesticks are the language of financial markets. If you missed our introduction to the Candlesticks Basics, please visit our Part 1😎
Candlestick Patterns
Candlestick patterns are one of the most powerful trading concepts, and they are simple, easy to identify, and very profitable setups. Research has confirmed that candlestick patterns have a high predictive value and can produce positive results. If you know how to read candlestick patterns correctly, you will understand what these patterns tell you about the market dynamics and the trader's behaviour.
That said, Patterns are separated into bullish and bearish. Bullish patterns indicate that the price is likely to rise, while bearish patterns suggest that the price is likely to fall. No pattern works all the time, as candlestick patterns represent tendencies in price movement, not guarantees.
Bullish Engulfing Pattern
The bullish engulfing bar consists of two candlesticks, the first one is the small body, and the second is the engulfing candle.
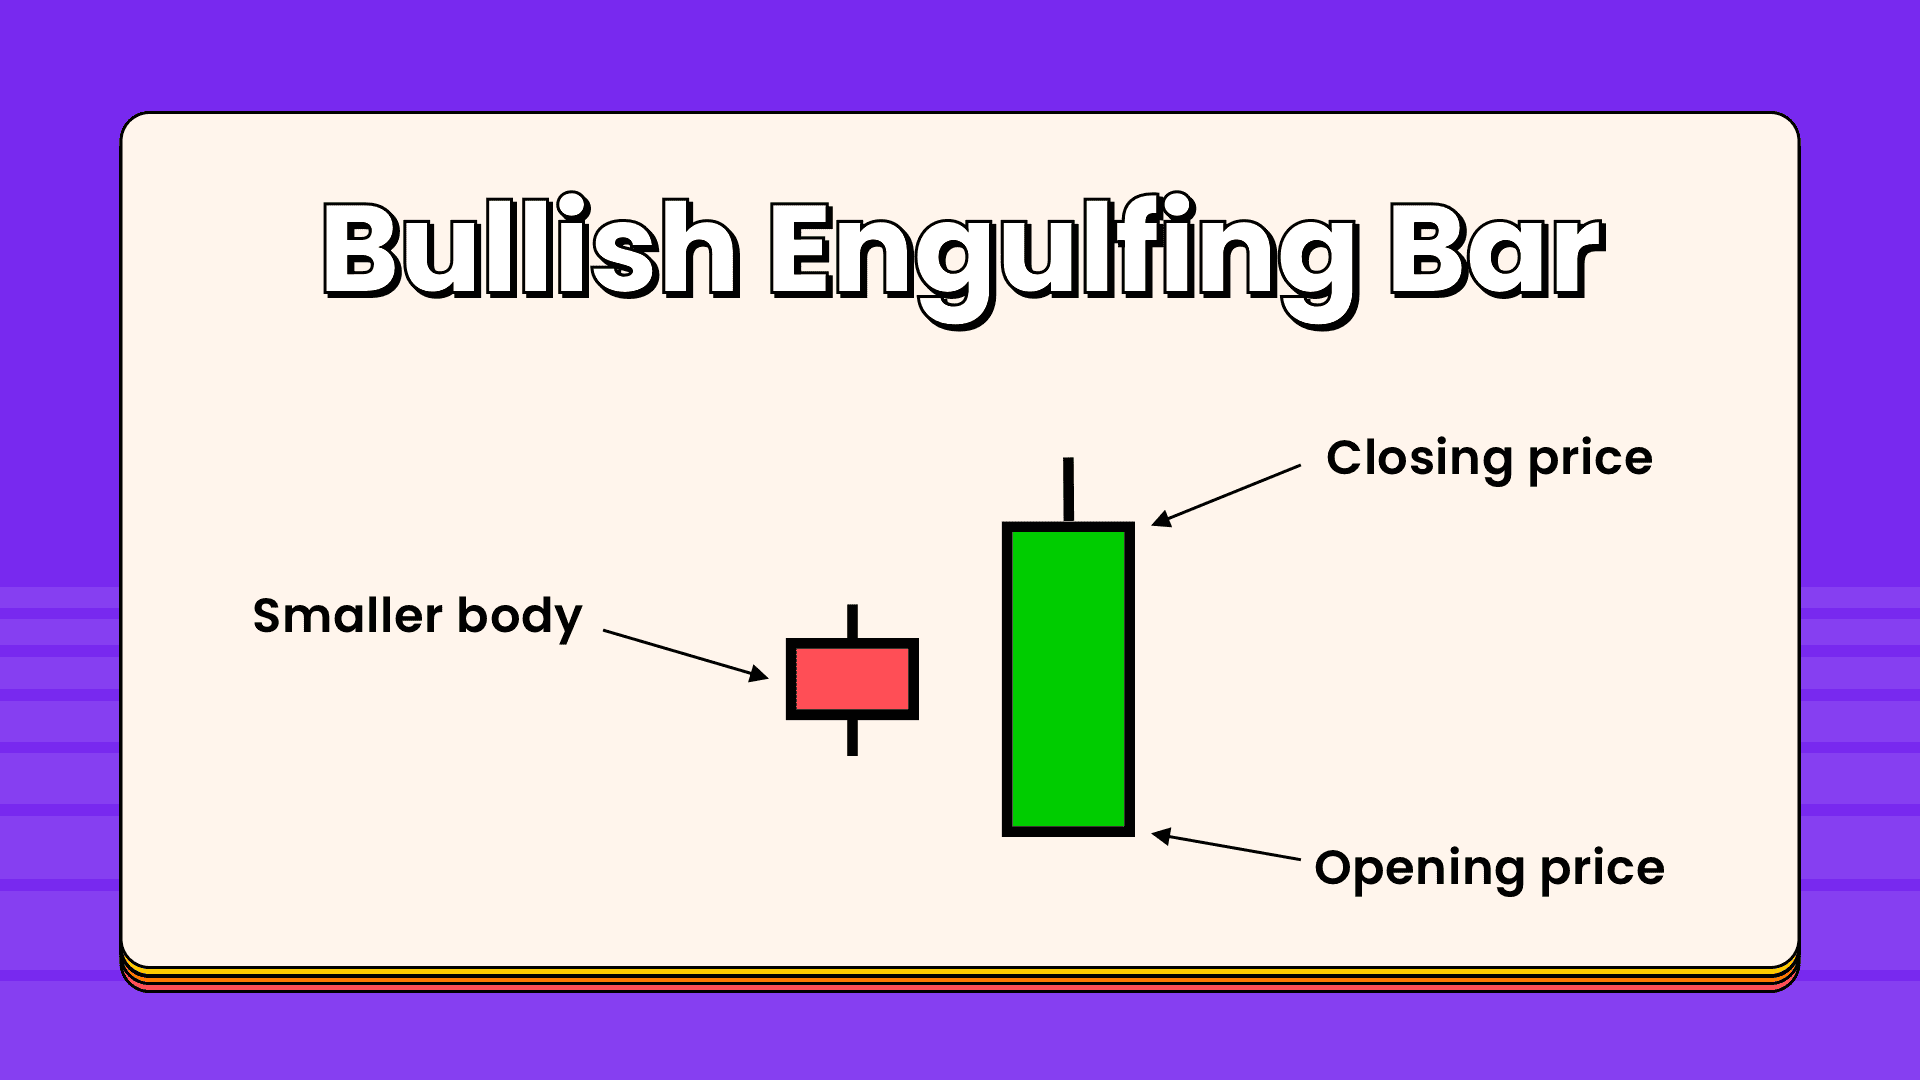
The bullish engulfing bar pattern tells us that the market is no longer under the control of sellers, and buyers will take control of the market. When a bullish engulfing candle forms in the context of an uptrend, it indicates a continuation signal. When a bullish engulfing candle forms at the end of a downtrend, the reversal is much more powerful as it represents a capitulation bottom.
Bearish Engulfing Pattern
The bearish engulfing is one of the most crucial candlestick Patterns. This candlestick pattern consists of two bodies: The first body is smaller than the second; in other words, the second body engulfs the previous one.
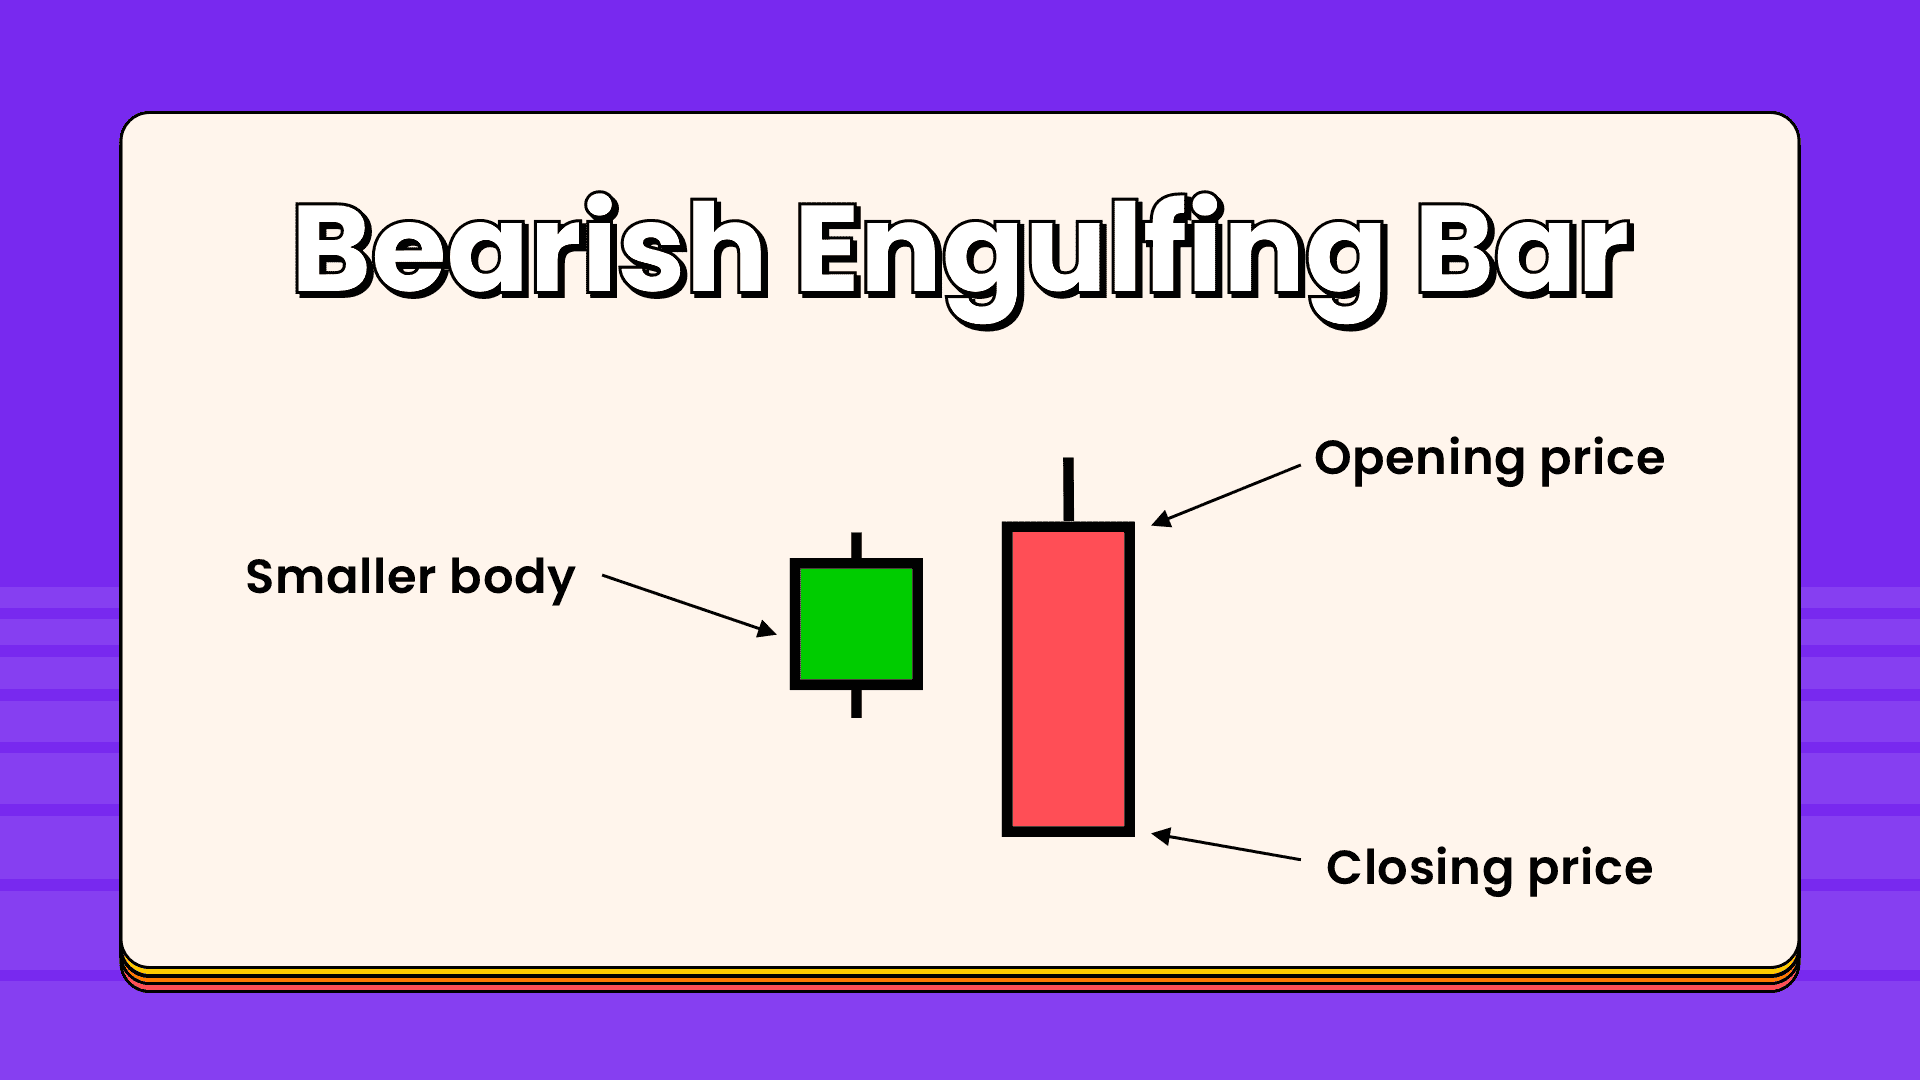
A bearish engulfing pattern develops in an uptrend when sellers outnumber buyers. This action is reflected by a long red real body engulfing a small green real body. The pattern indicates that sellers are back in control and that the price could continue to decline.
The Doji Candlestick Pattern
Doji is one of the essential candlestick patterns; when this candlestick forms, it tells us that the market opens and closes at the same price, which means that there is equality and indecision between buyers and sellers, there is no one in control of the market.
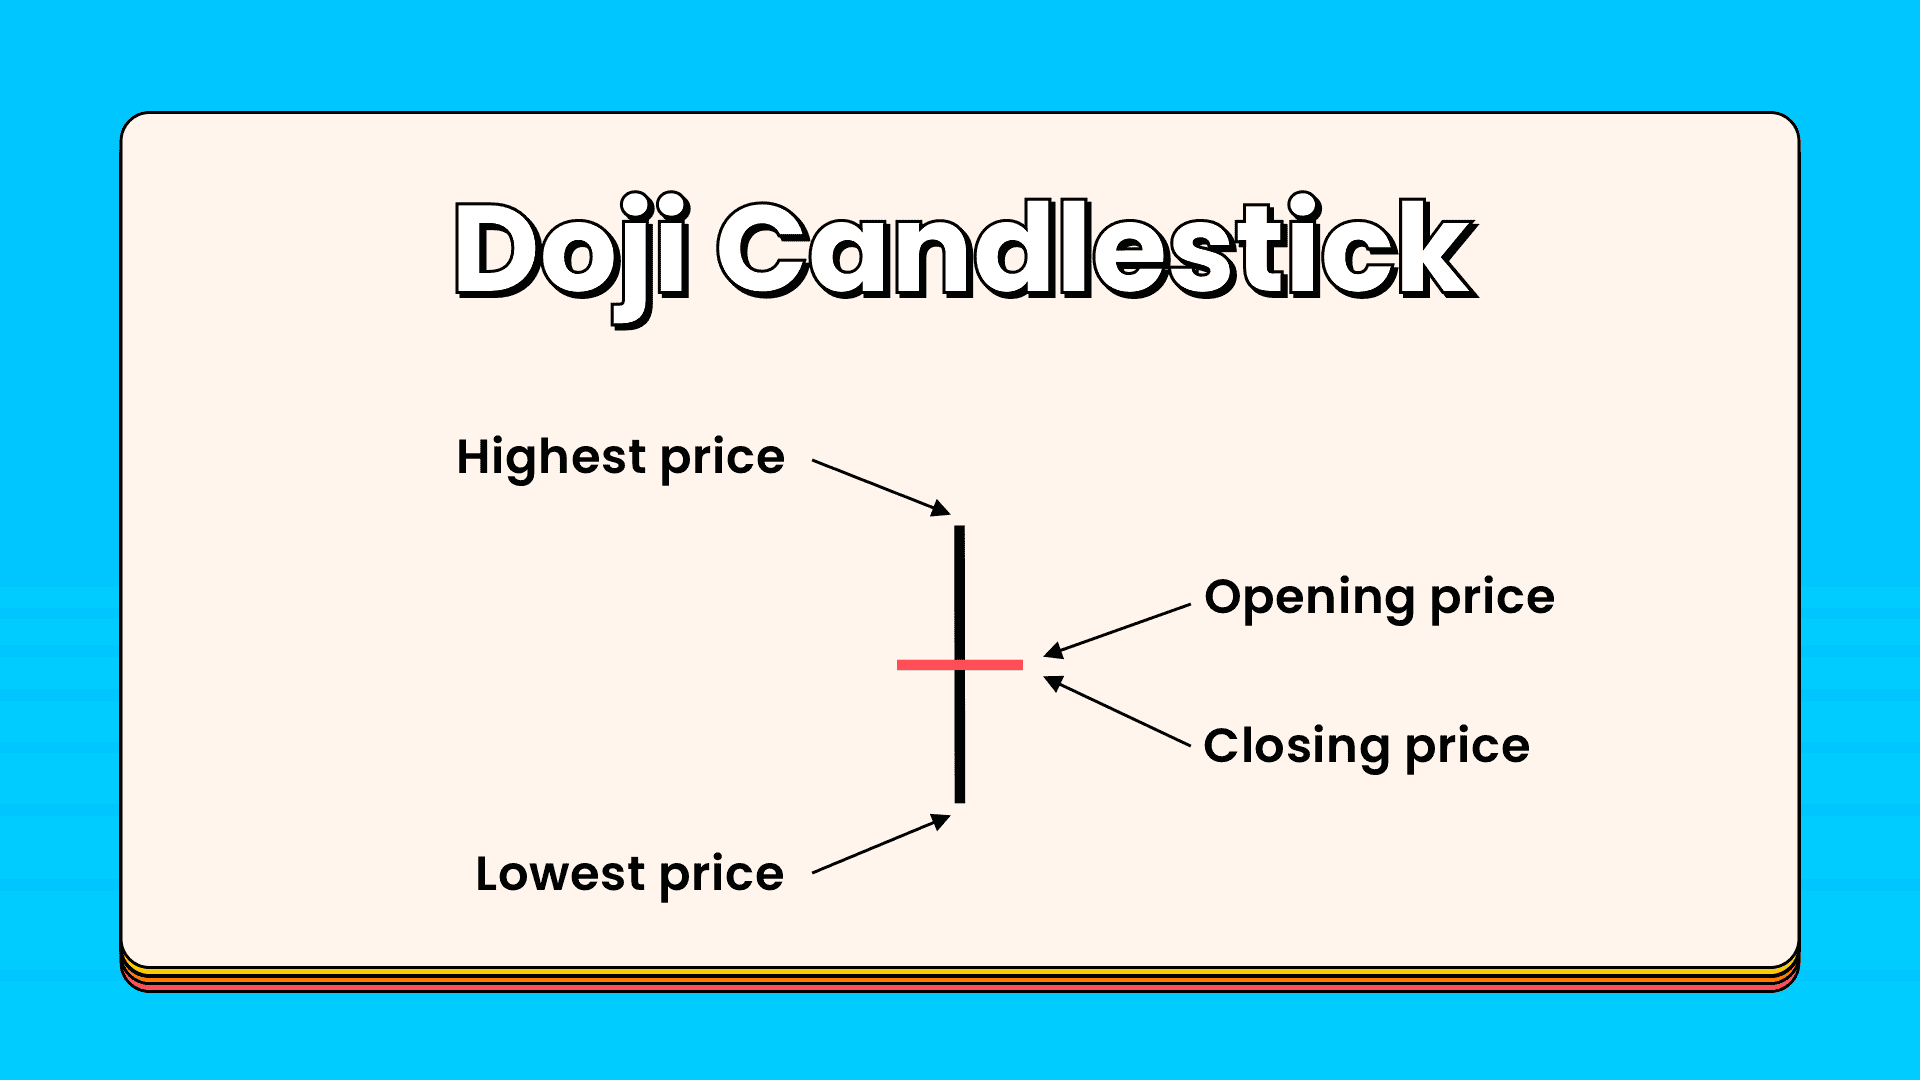
The formation of the Doji candlestick indicates that buyers cannot keep prices higher, and sellers push prices back to the opening price. This is a clear indication that a trend reversal is likely to happen. When it is found at the bottom or the top of a trend, it is considered a sign that a prior trend is losing its strengths.
The Morning Star
The morning star pattern is considered a bullish reversal pattern; it often occurs at the bottom of a downtrend and consists of three candlesticks.
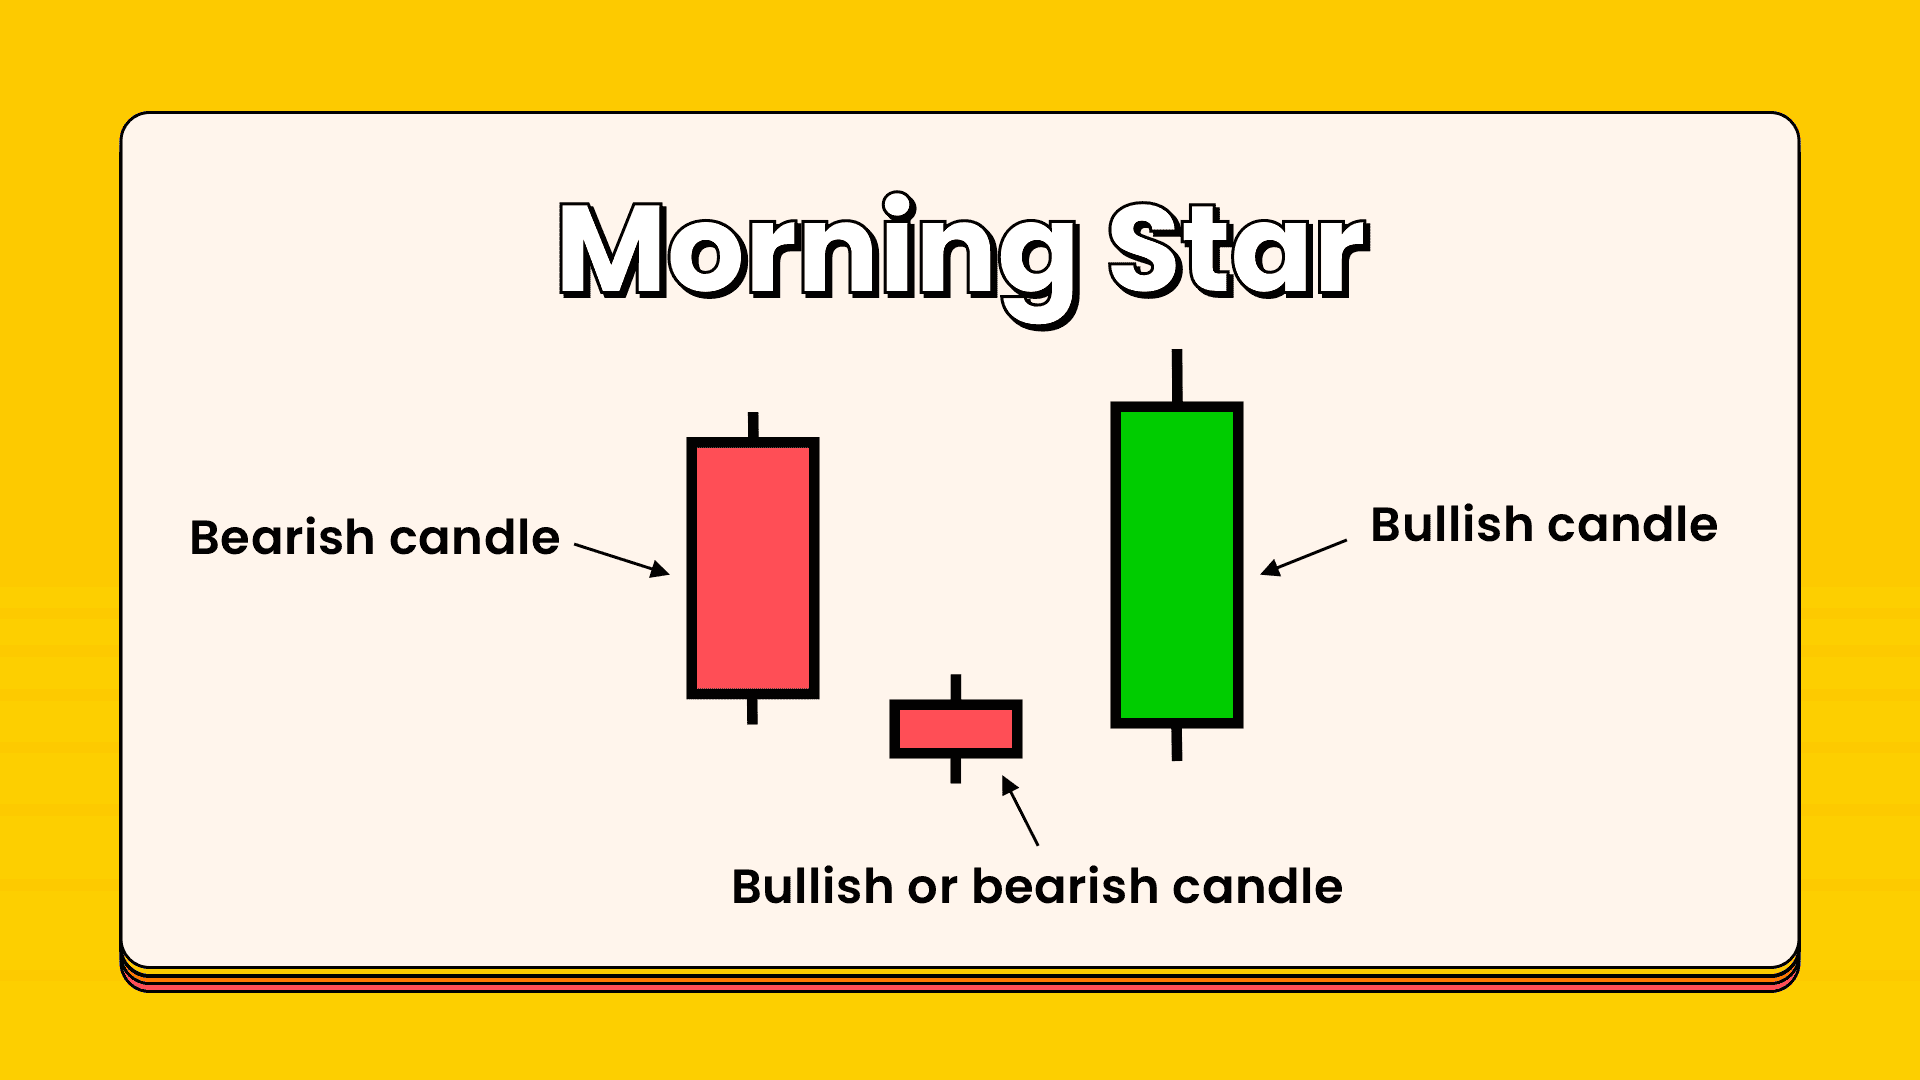
The morning star pattern shows us how buyers took control of the market from sellers; when this pattern occurs at the bottom of a downtrend near a support level, it is interpreted as a powerful trend reversal sign.
The Evening Star Pattern
An evening star is a topping pattern. The last candle identifies it in the pattern opening below the previous day's small real body. The small real body can be either red or green. The previous candle closes deep into the real body of the candle two days prior. The pattern shows a stalling of the buyers and the sellers taking control. More selling could develop.
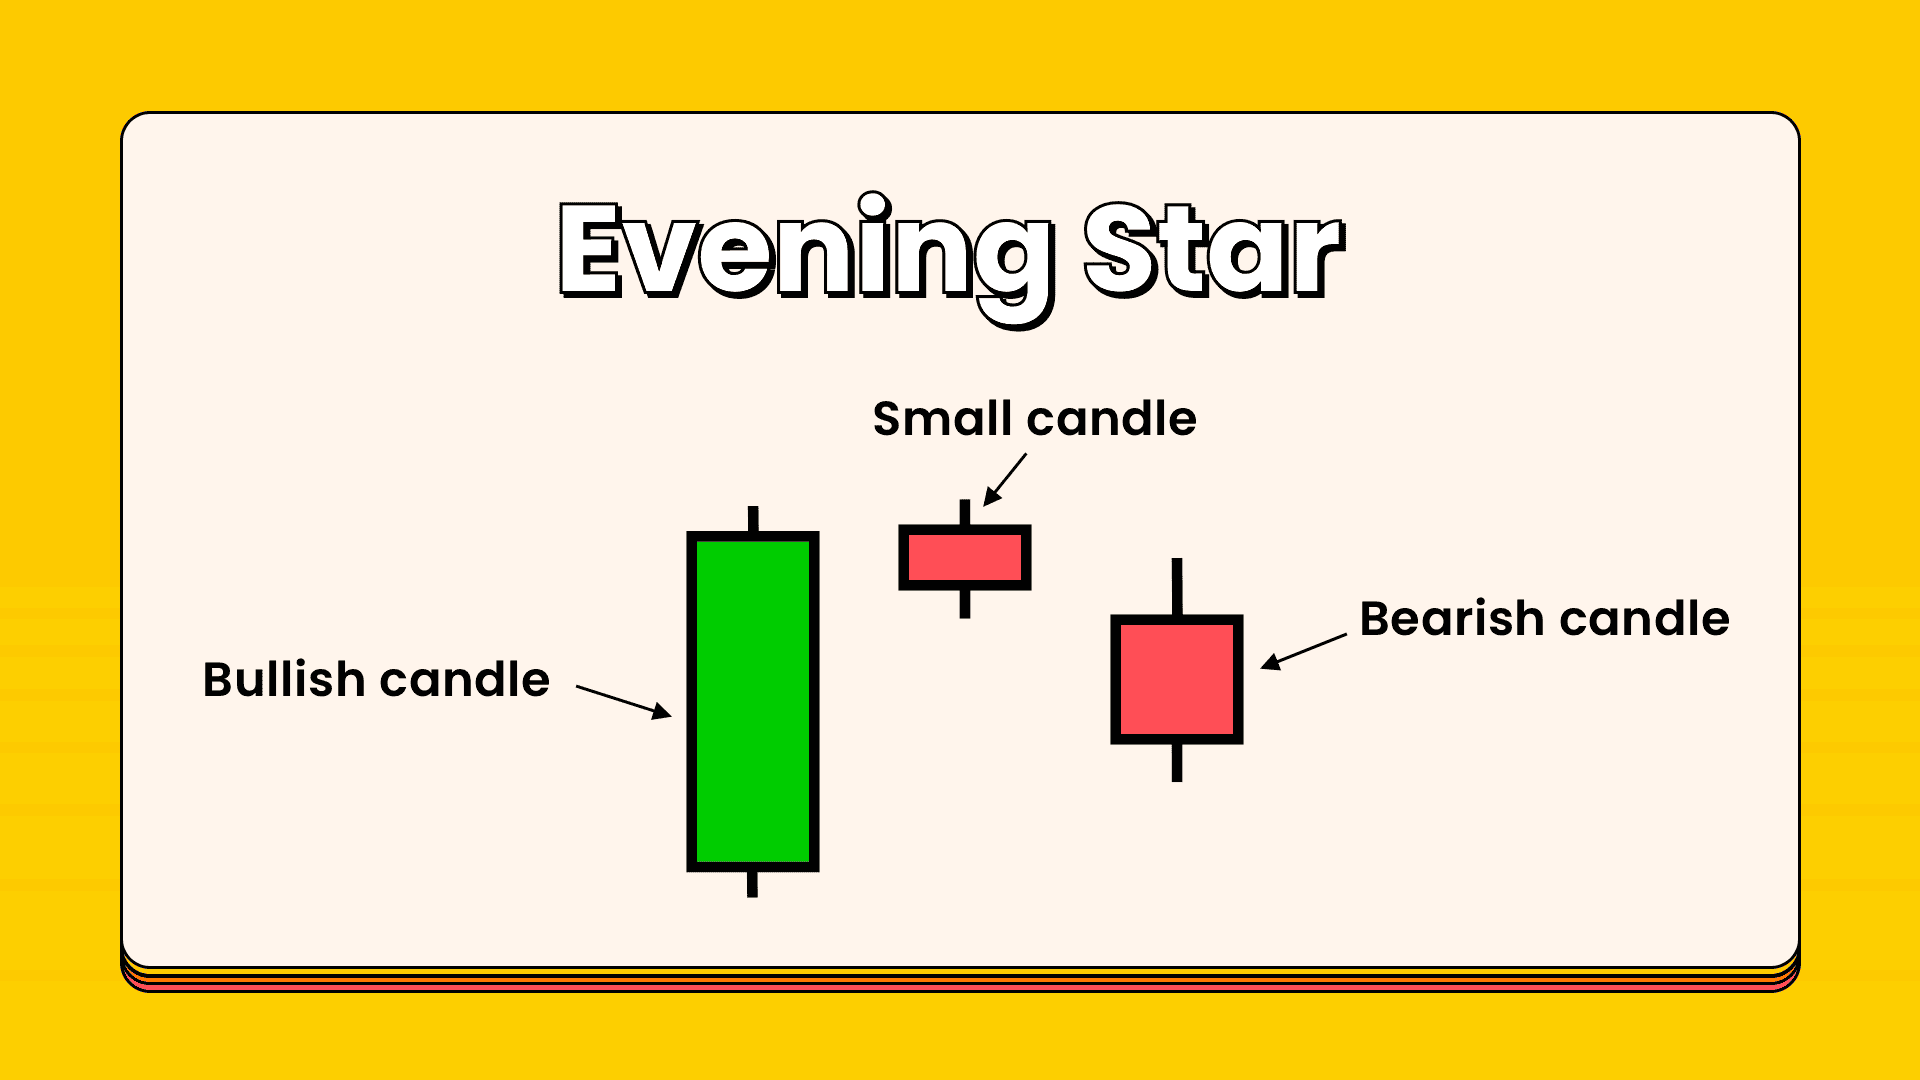
It usually consists of three candlesticks and usually occurs at the top of an uptrend.
The Hammer(Pin Bar)
The Hammer candlestick is created when the open high and close are roughly the same price; it is also characterized by a long lower shadow that indicates a bullish rejection from buyers and their intention to push the market higher.
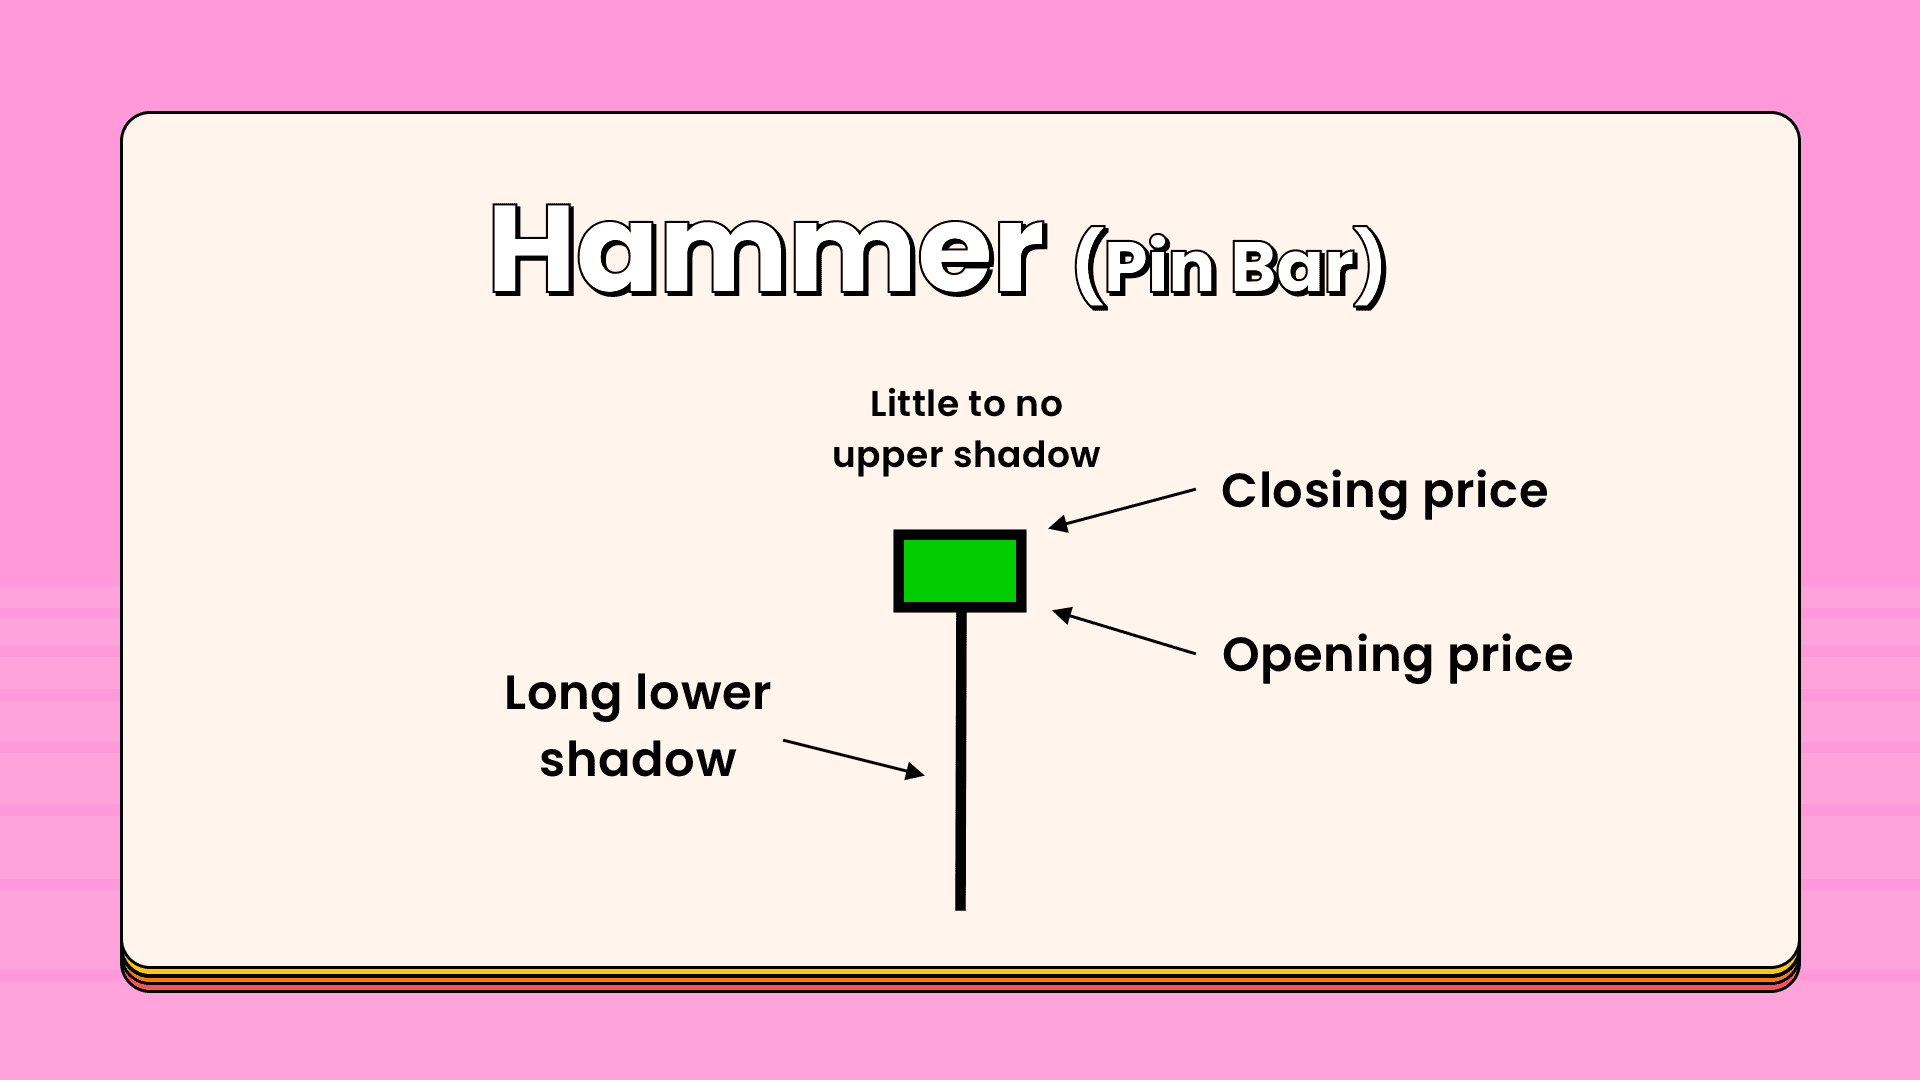
The hammer is considered a reversal candlestick pattern at the bottom of a downtrend.
The Shooting Star (Bearish Pin Bar)
The shooting formation is formed when the open low and close are roughly the same price, and this candle is characterized by a small body and a long upper shadow. It is the bearish version of the hammer. Professional technicians say that the shadow should be twice the length of the real body.
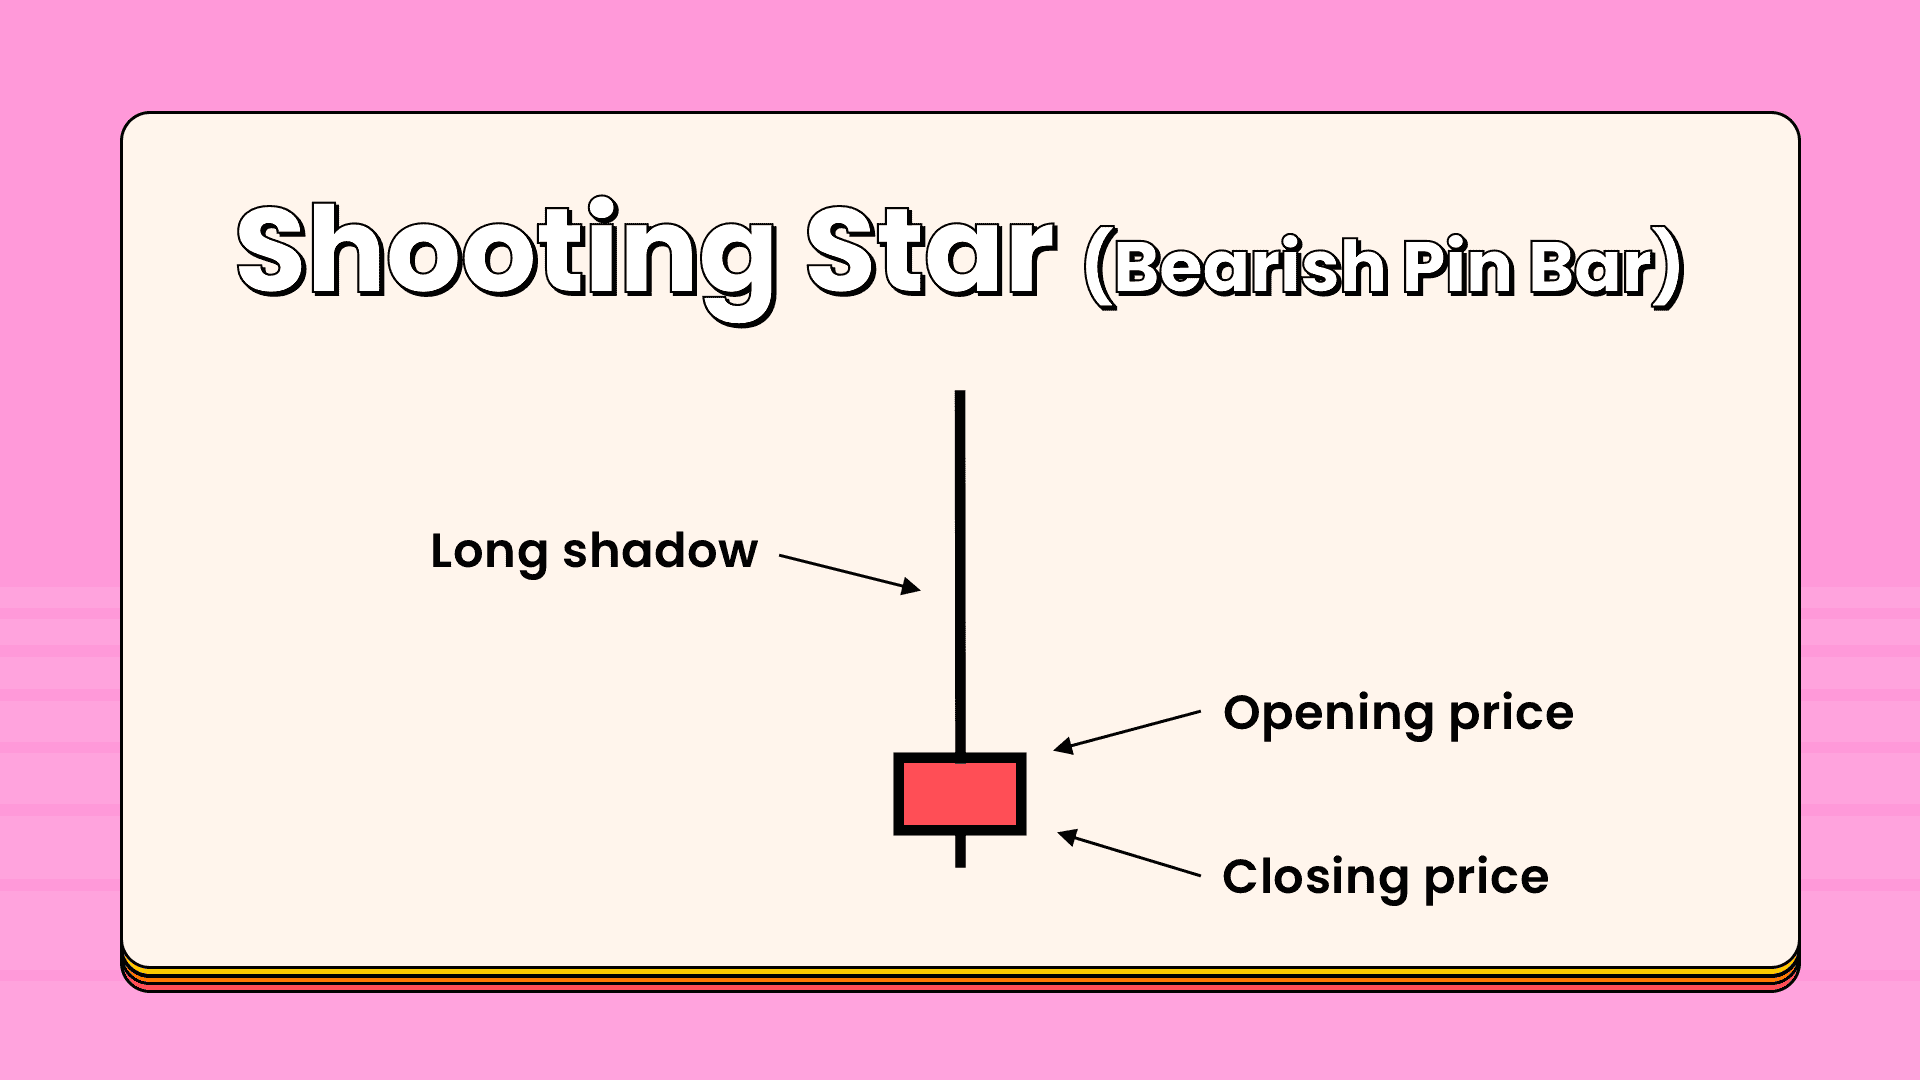
The psychology behind this pattern is that buyers try to push the market higher, but they get rejected by selling pressure.
The Harami Pattern
The Harami pattern (pregnant in Japanese) is considered a reversal and continuation pattern and consists of two candlesticks. For the Harami pattern to be valid, the second candle should close outside the previous one.
This candlestick pattern is considered a bearish reversal signal when it occurs at the top of an uptrend and a bullish signal at the bottom of a downtrend.
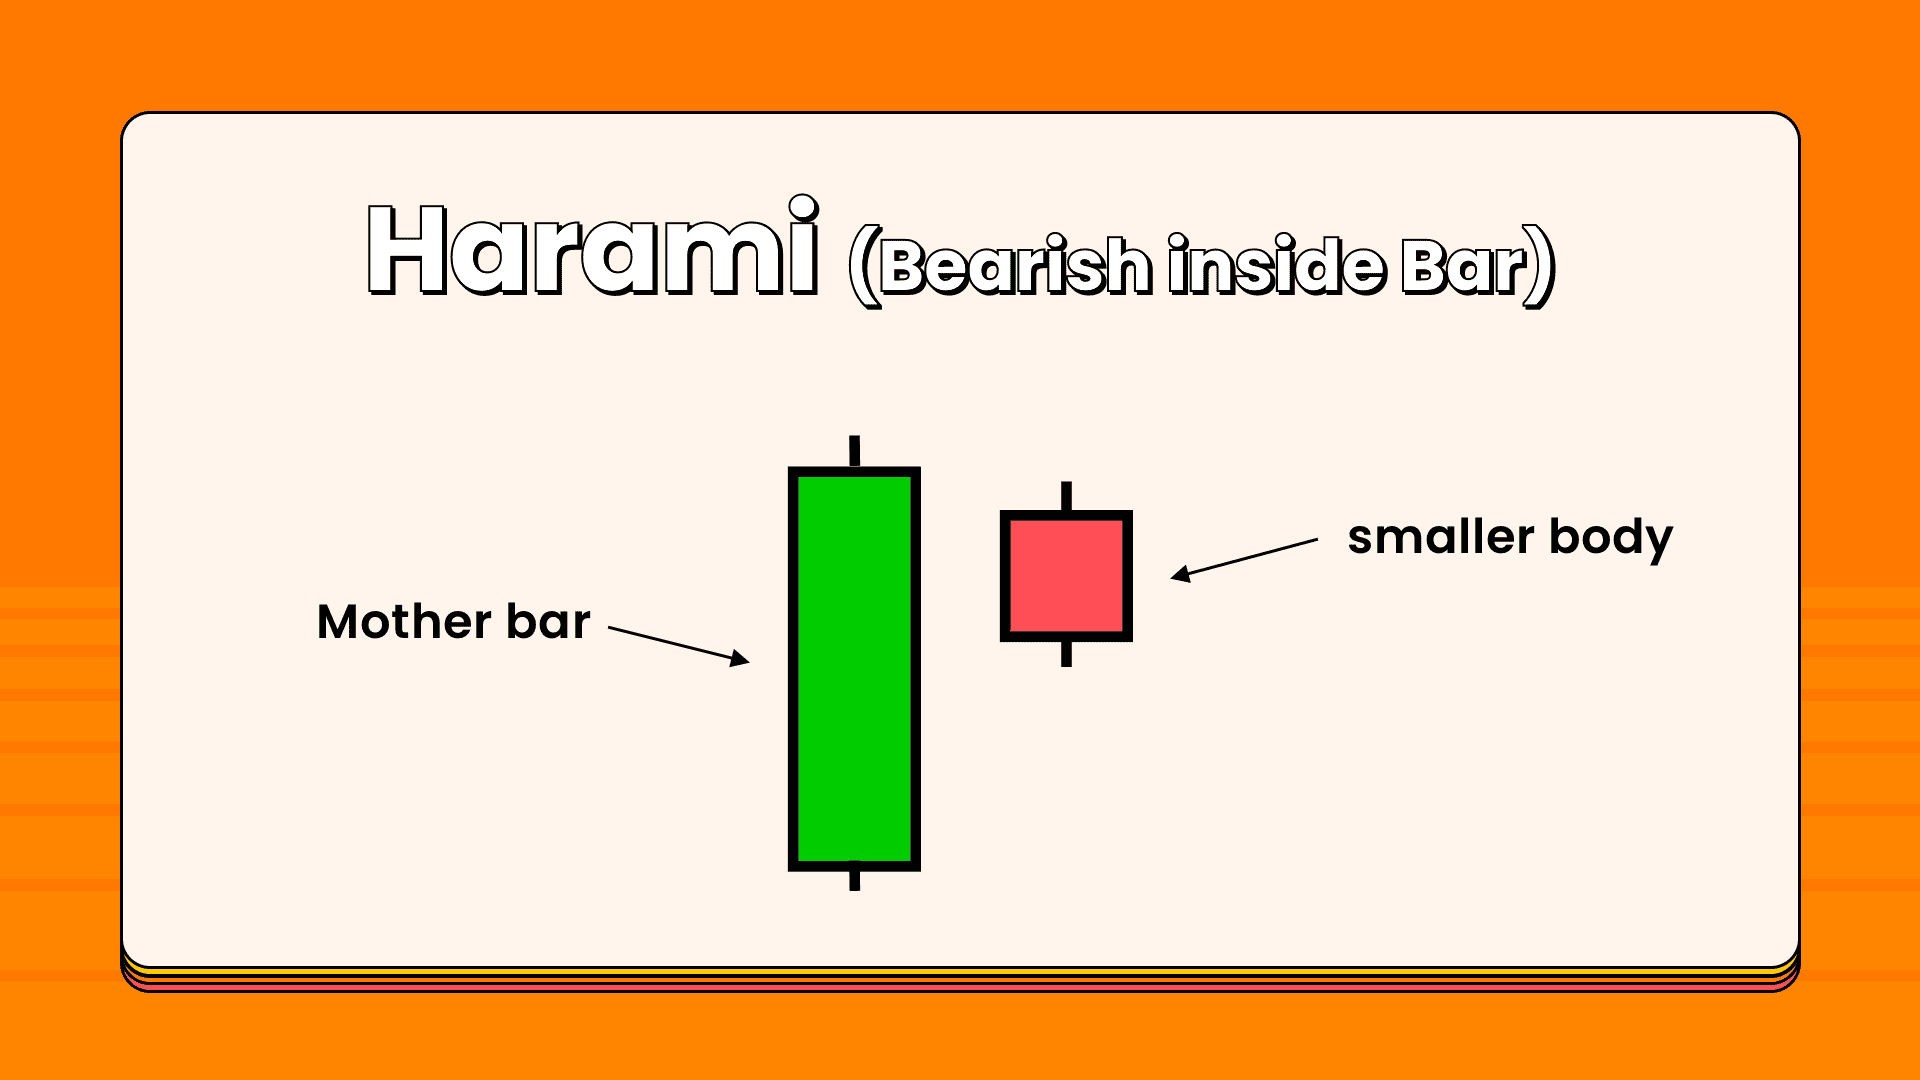
The Harami candle tells us that the market is in an indecision period. In other words, the market is consolidating. So, buyers and sellers don't know what to do, and there is no one in control of the market.
The Tweezer Tops and Bottom
The tweezer's top formation is considered a bearish reversal pattern and is seen at the top of an uptrend. The tweezer's bottom formation is interpreted as a bullish reversal pattern seen at the bottom of a downtrend.
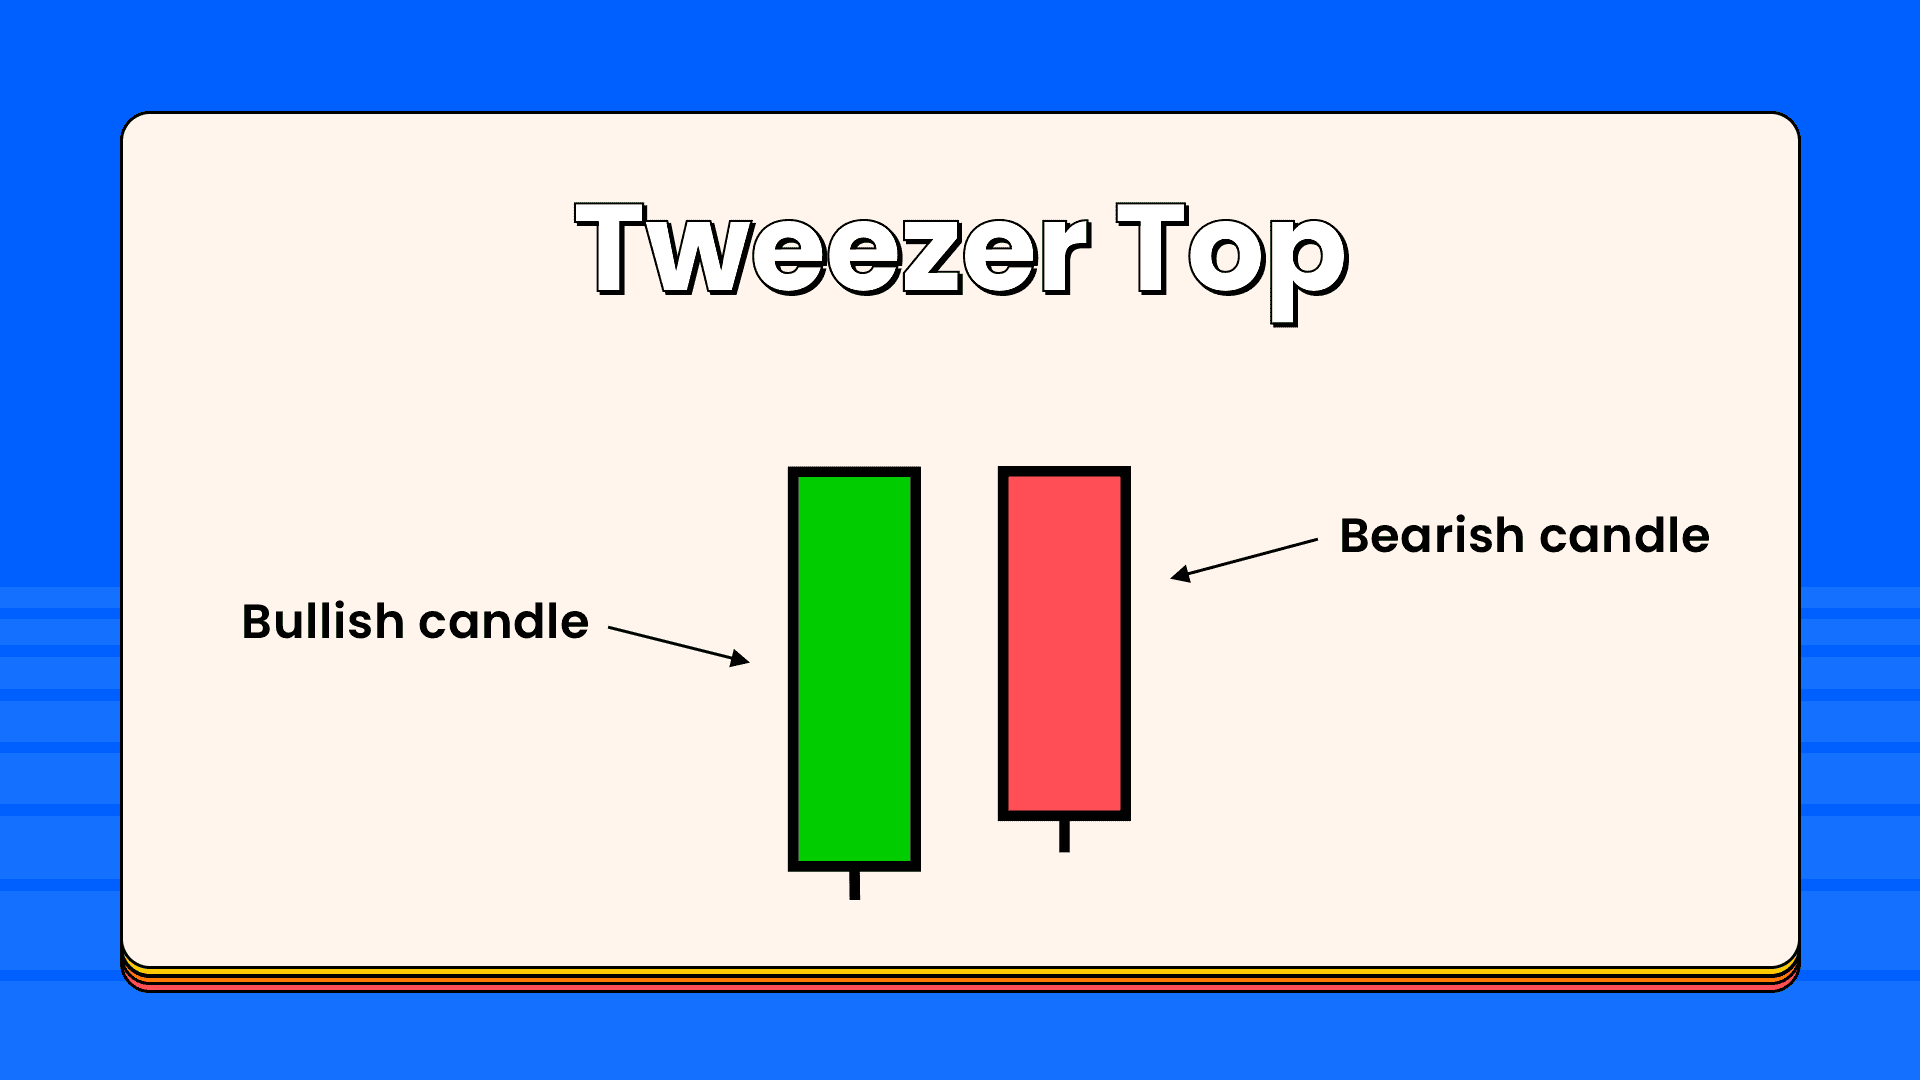
The tweezer's top formation consists of two candlesticks. The first candle is bearish followed by a bullish candlestick. So we can say that the tweezers bottom is the bullish version of the tweezers top. The tweezers top occurs during an uptrend when buyers push the price higher, this gave us the impression that the market is still going up, but sellers surprised buyers by pushing the market lower and closing down the opening of the bullish candle.
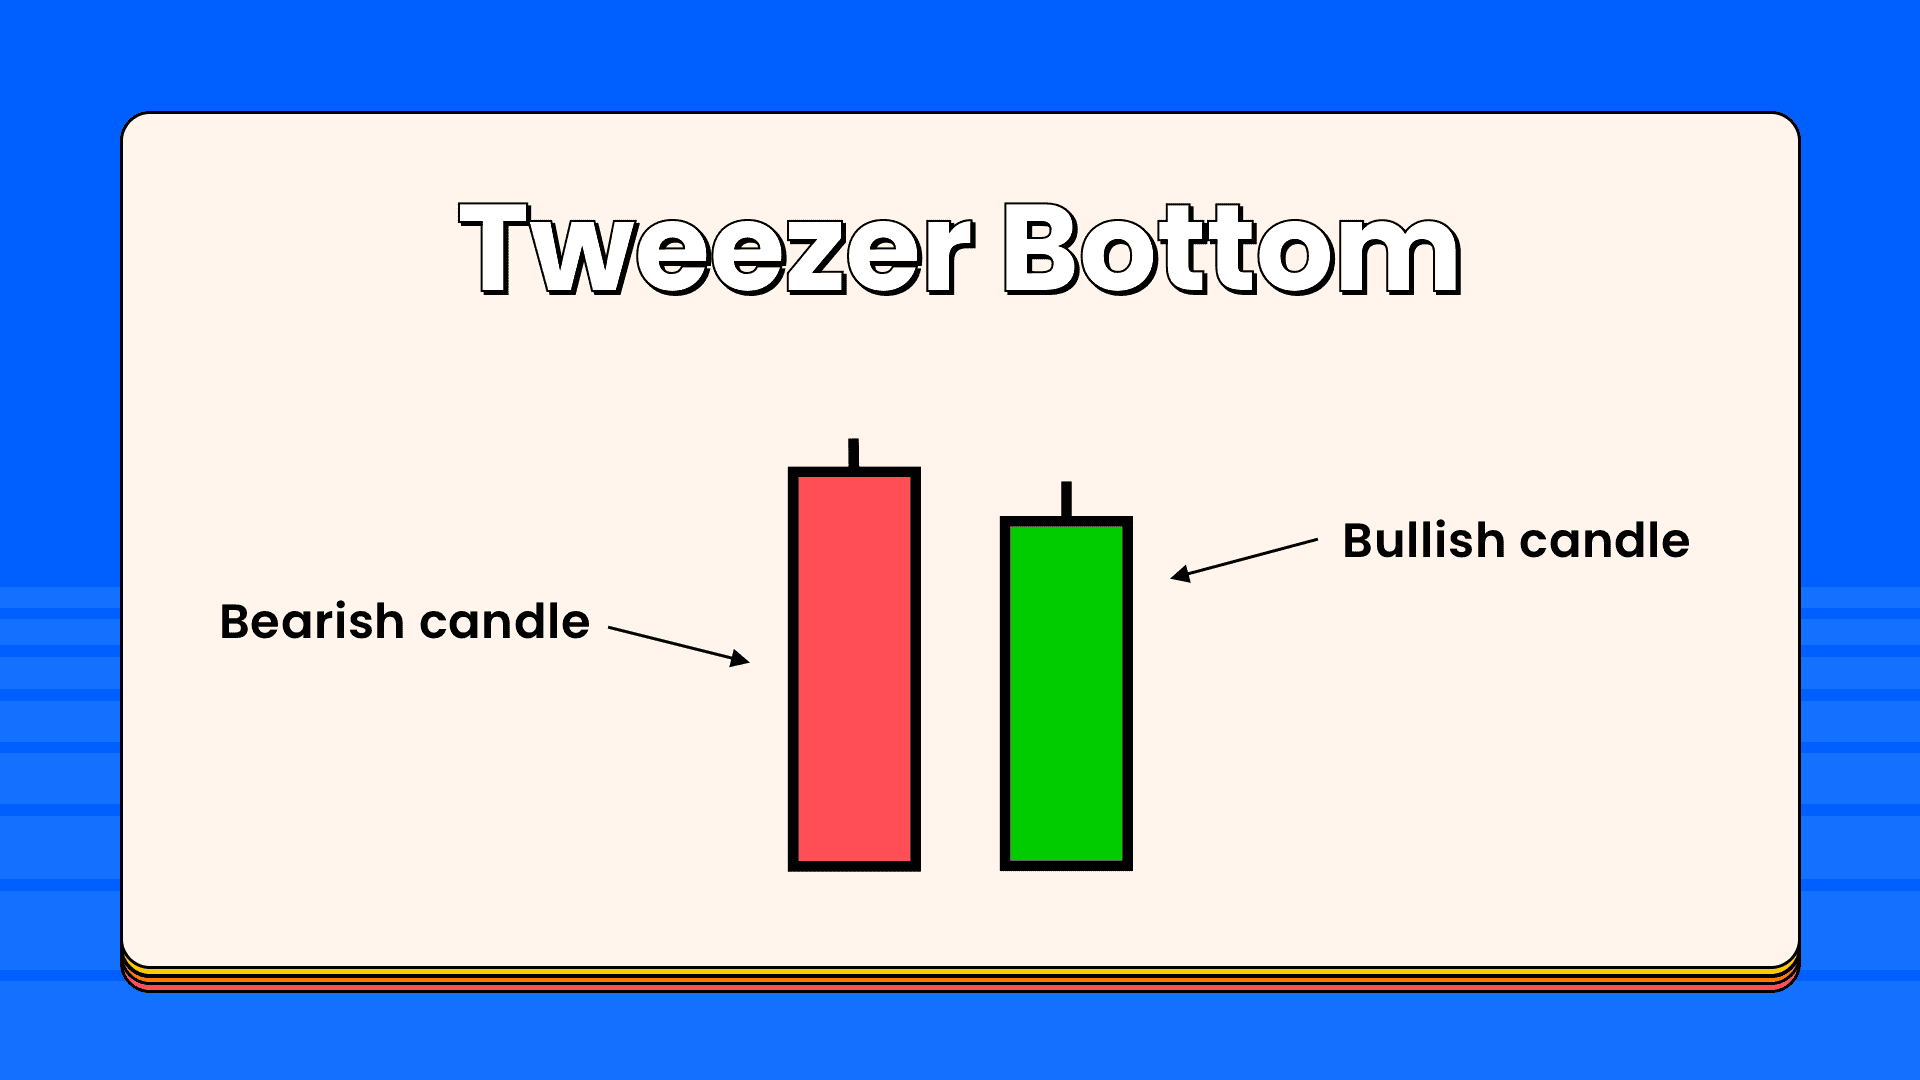
On the other hand, The tweezers bottom happens during a downtrend when sellers push the market lower, we feel that everything is going all right, but the next session price closes above or roughly at the same price of the first bearish candle which indicates that buyers are coming to reverse the market direction.
In Part 3, we will show you how to study a candlestick chart and trade! Stay Tuned✨

Try reading the candlestick on Pocket Trader to get prepared for your next trade! Practice makes profits 😎🔥