Support and Resistance Basics


Key Takeaways:
- Support refers to a price level at which an asset stops falling and bounces back up, while resistance is a price level at which the stock stops rising and reverses its direction
- Using trendlines is one of the most common ways of spotting support and resistance levels in a chart
- By identifying key levels where the price is likely to bounce off or reverse, traders can make informed decisions about when to enter or exit trades
Understanding the concepts of support and resistance is crucial for traders and investors. These fundamental concepts help analyze stock price movements and make informed decisions. Support refers to a price level at which an asset stops falling and bounces back up, while resistance is when an asset stops rising and reverses its direction. By identifying these key levels on a price chart, traders can anticipate potential price reversals and plan their entry and exit points accordingly. This article will explain the significance of support and resistance levels and how to identify them on a chart. Whether you are a novice trader or a seasoned investor, mastering these basics will undoubtedly enhance your trading skills and increase your chances of success in the market.
What is Support?
Support in trading refers to a price level at which a stock or asset tends to stop falling and, instead, experiences increased buying interest, preventing it from dropping further. It is a key indicator for traders and investors to determine potential entry and exit points. Support levels are typically determined through technical analysis, where historical price data is used to identify areas where prior price declines have been halted and a reversal has occurred. These levels are areas of opportunity for investors to buy an asset at a potentially lower price with the expectation of a subsequent price increase.
What is Resistance?
Resistance refers to a significant price level in trading where an asset struggles to break through when moving upwards. It is a psychological barrier typically caused by a concentration of sell orders at that particular price point. Investors and traders use resistance levels to help predict potential price movements and make informed decisions about buying or selling assets. By understanding resistance levels, market participants can identify possible areas of price reversal or consolidation, which can be crucial in developing successful trading strategies. It is essential to pay close attention to resistance levels when analyzing the market and considering investment decisions.

How do you find support and resistance zones?
One can look at historical price data and market structure to find support and resistance levels and identify significant areas where the price has repeatedly stalled or reversed. For instance, in trending markets, support and resistance are formed from swing points. In an uptrend, the previous swing point acts as a support level; in a downtrend, the old swing point acts as a resistance level.
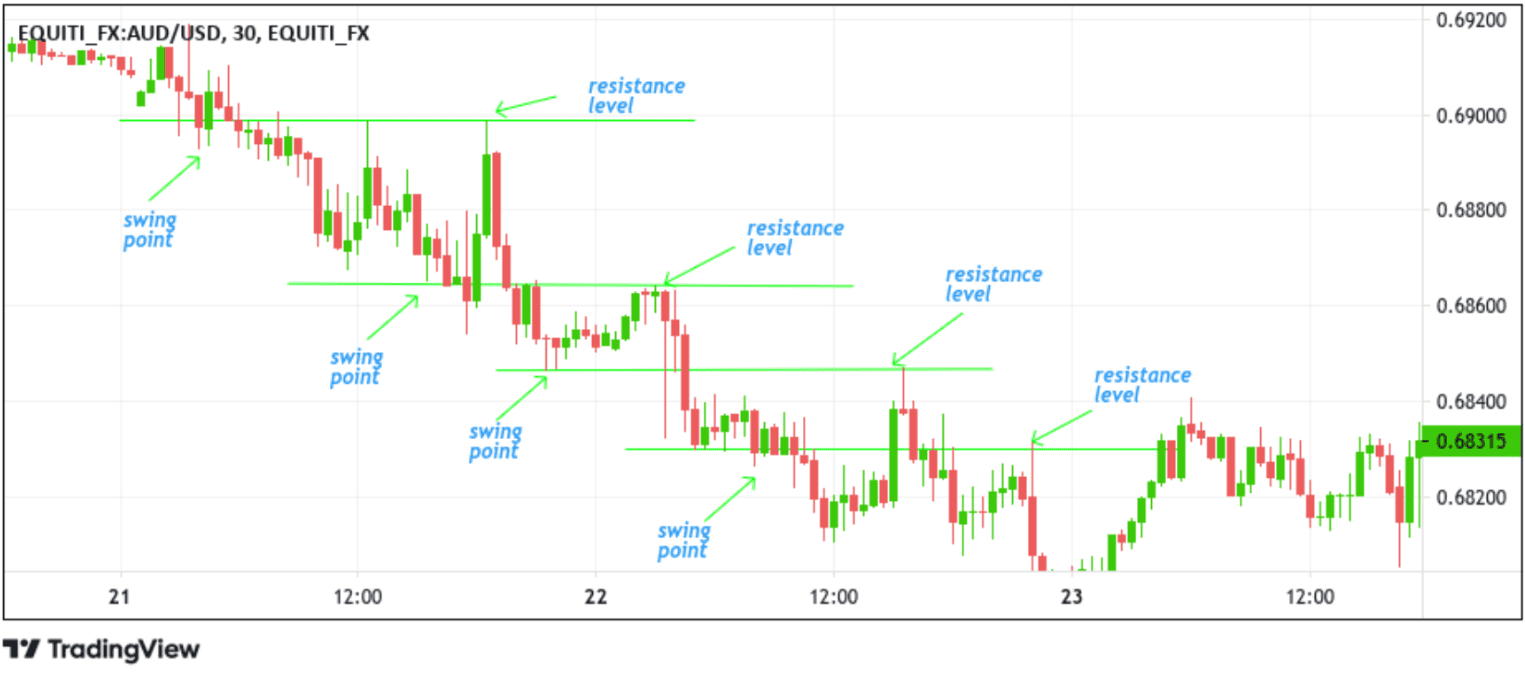
In the example above, the previous swing points in a downtrend act as resistance levels after the breakout. When the market makes the retracement move, it respects the last point swing (resistance level), representing the beginning of another impulsive move, hence making it a suitable place to enter a Sell trade in favour of the trend. Additionally, when the market tests the previous swing point (support level), it goes up again (offers an opportunity to re-enter the trade again).
Additionally, drawing a trendline in a trending market is another way traders can spot resistance and support levels and use them to their advantage to enter a BUY/SELL trade.
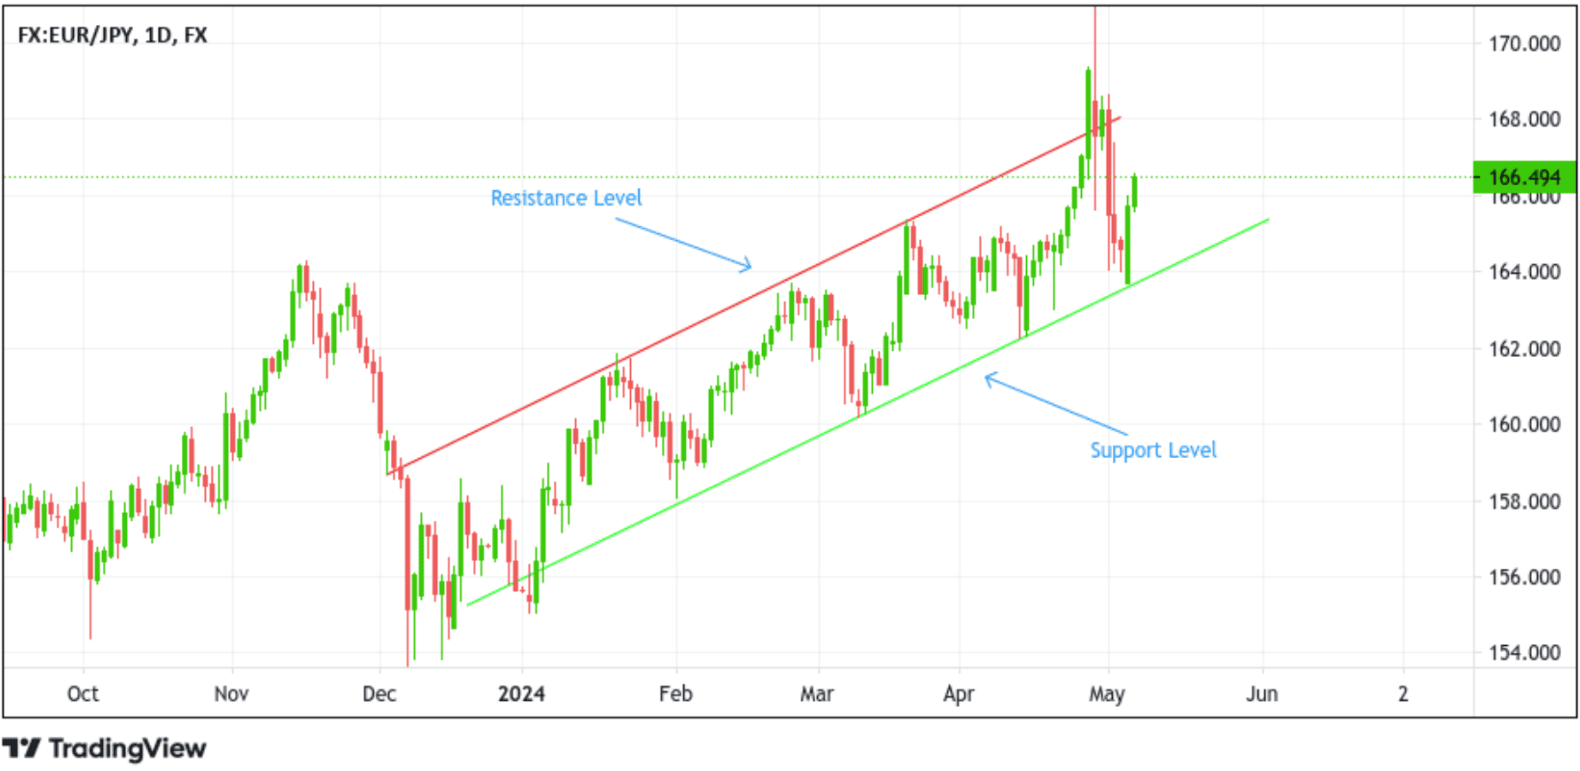
In the example above, you can see the market respects the trendlines, and when prices approach them (in this case, the resistance and support levels), the market reverses and continues in the same direction.
Other tools traders can use to pinpoint these crucial levels besides trendlines include moving averages and Fibonacci retracement levels. Additionally, paying attention to trading volume and market sentiment can confirm support and resistance zones.
Conclusion
In conclusion, understanding the basics of support and resistance is crucial for traders and investors in the financial markets. By identifying key levels where the price is likely to bounce off or reverse, traders can decide when to enter or exit trades. Support and resistance levels are not just lines on a chart but represent significant psychological and supply/demand dynamics in the market. By incorporating these concepts into their analysis, traders can improve their chances of success and protect their capital from unnecessary risks. Developing a deep understanding of support and resistance basics is essential to becoming a more confident and profitable trader.

Looking to grow your wealth through social trading? Look no further than Pocket Trader! With Pocket Trader, you can connect with other traders, learn from experienced investors, and share your own insights with the community! Trade wiser now.