Introduction to Candlesticks Basics (Part 1)


Learning candlestick is like learning a new language. Imagine you got a book that is written in a foreign language; you look at the pages, but you get nothing from what is written. The same thing happens when it comes to financial markets. If you don't know how to read candlesticks, you will never be able to trade the Market. Candlesticks are the language of financial markets; if you get the skill of reading charts, you will understand what the market is telling you, and you will be able to make the right decision at the right time.
Why are Candlesticks important to your Trading Analysis?
Candlesticks are essential to your trading analysis because it is considered a visual representation of what is going on in the market. By looking at a candlestick, we can get valuable information about the open, high, low, and the close of price, which will give us an idea about the price movement. Candlesticks provide more valuable information than bar charts; using them is a win-win situation because you can get all the trading signals. Having looked at the importance of candlesticks in your trading analysis, let's now dive in and look at the definition of a candlestick, its components, and the different types of candlestick patterns.
What is a Candlestick
Candlesticks show that emotion by visually representing the size of price moves with different colours. Traders use candlesticks to make trading decisions based on regularly occurring patterns that help forecast the short-term direction of the price.
Candlesticks are formed using the chosen time frame open, high, low, and close. If the close is above the open, we can say that the candlestick is bullish, which means that the market is rising in this period. Bullish candlesticks are always displayed as green candlesticks. Conversely, If the close is below the open, we can say that the candlestick is bearish, indicating that the market is falling in this session. Bearish candles are always displayed as red candlesticks.
Candlestick Components
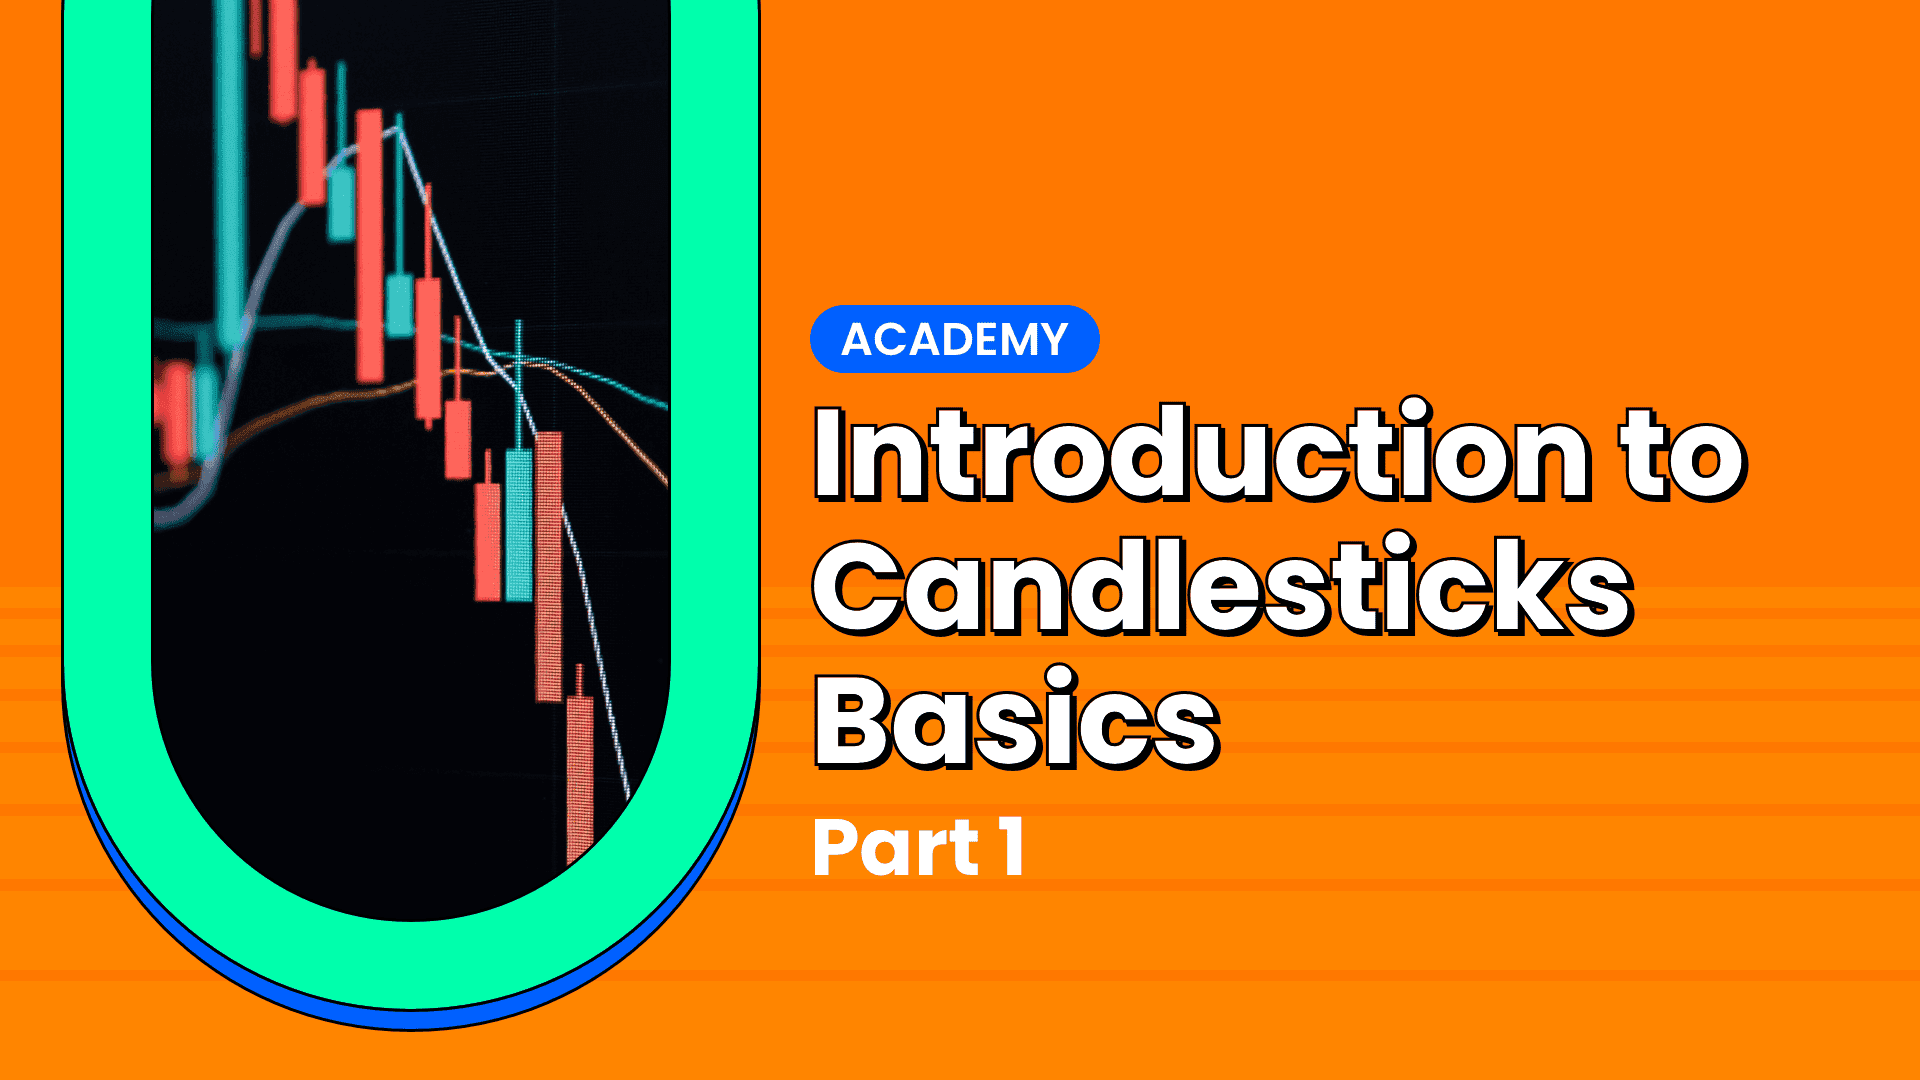
Just like a bar chart, a daily candlestick shows the market's open, high, low, and close prices for the day. The candlestick has a wide part, which is called the "real body." This real body represents the price range between the open and close of that day's trading. When the real body is filled in or green, the close is lower than the open. If the real body is red, the close is higher than the open. Just above and below the real body are the "shadows" or "wicks." The shadows show the high and low prices. If the upper shadow on a down candle is short, it indicates that the opening that day was near the high of the day.
Let's look at the various components of a candlestick to understand how they influence a trader's decision before he places a Buy or Sell Trade.
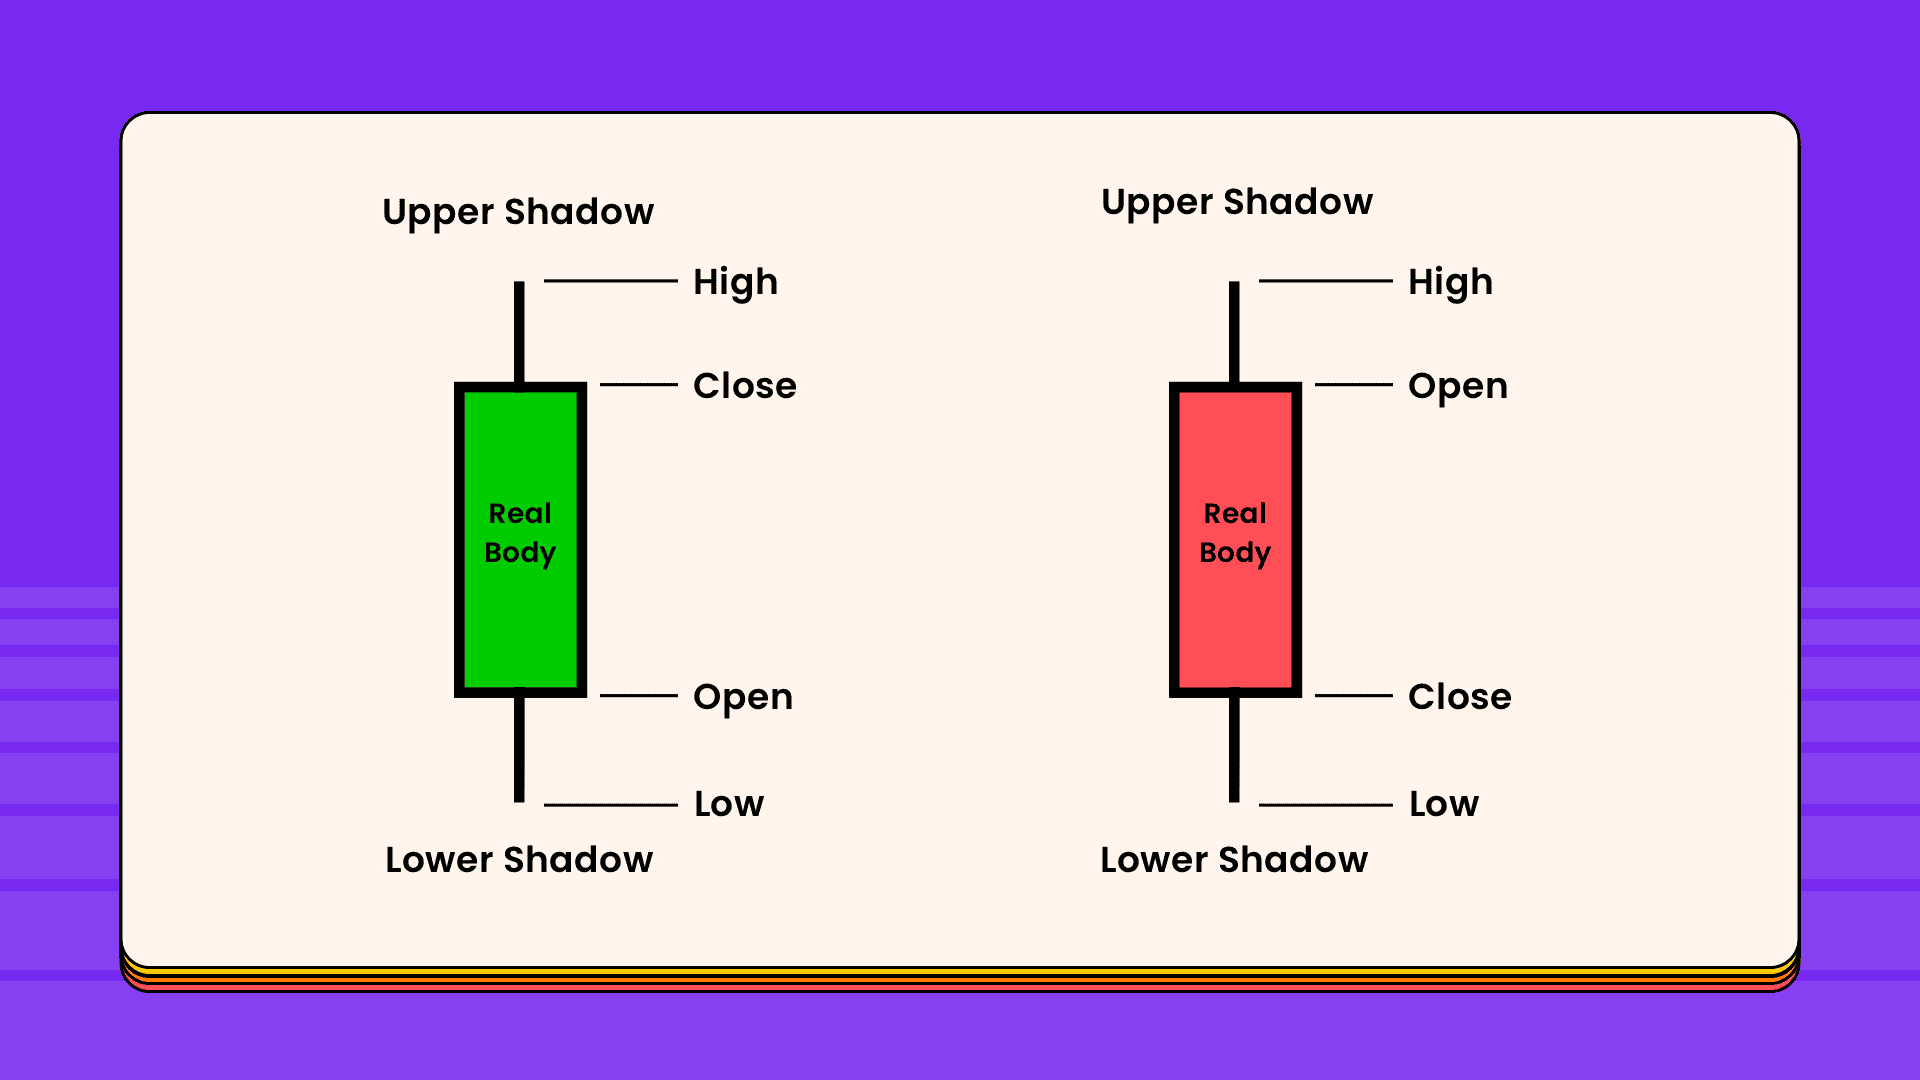
Candlestick Body Sizes
Long bodies refer to strong buying or selling pressure if there is a candlestick in which the close is above the open with a long body. This indicates that buyers are more substantial and taking control of the market during this period. Conversely, if there is a bearish candlestick in which the open is above the close with a long body, the selling pressure controls the market during this chosen time frame. Short and small bodies indicate little buying or selling activity.
Candlesticks Shadow
The upper and lower shadows give us essential information about the trading session.
- Upper shadows signify the session's high
- Lower shadows signify the session's low
Candlesticks with long shadows show that trading action occurred well past the open and close.
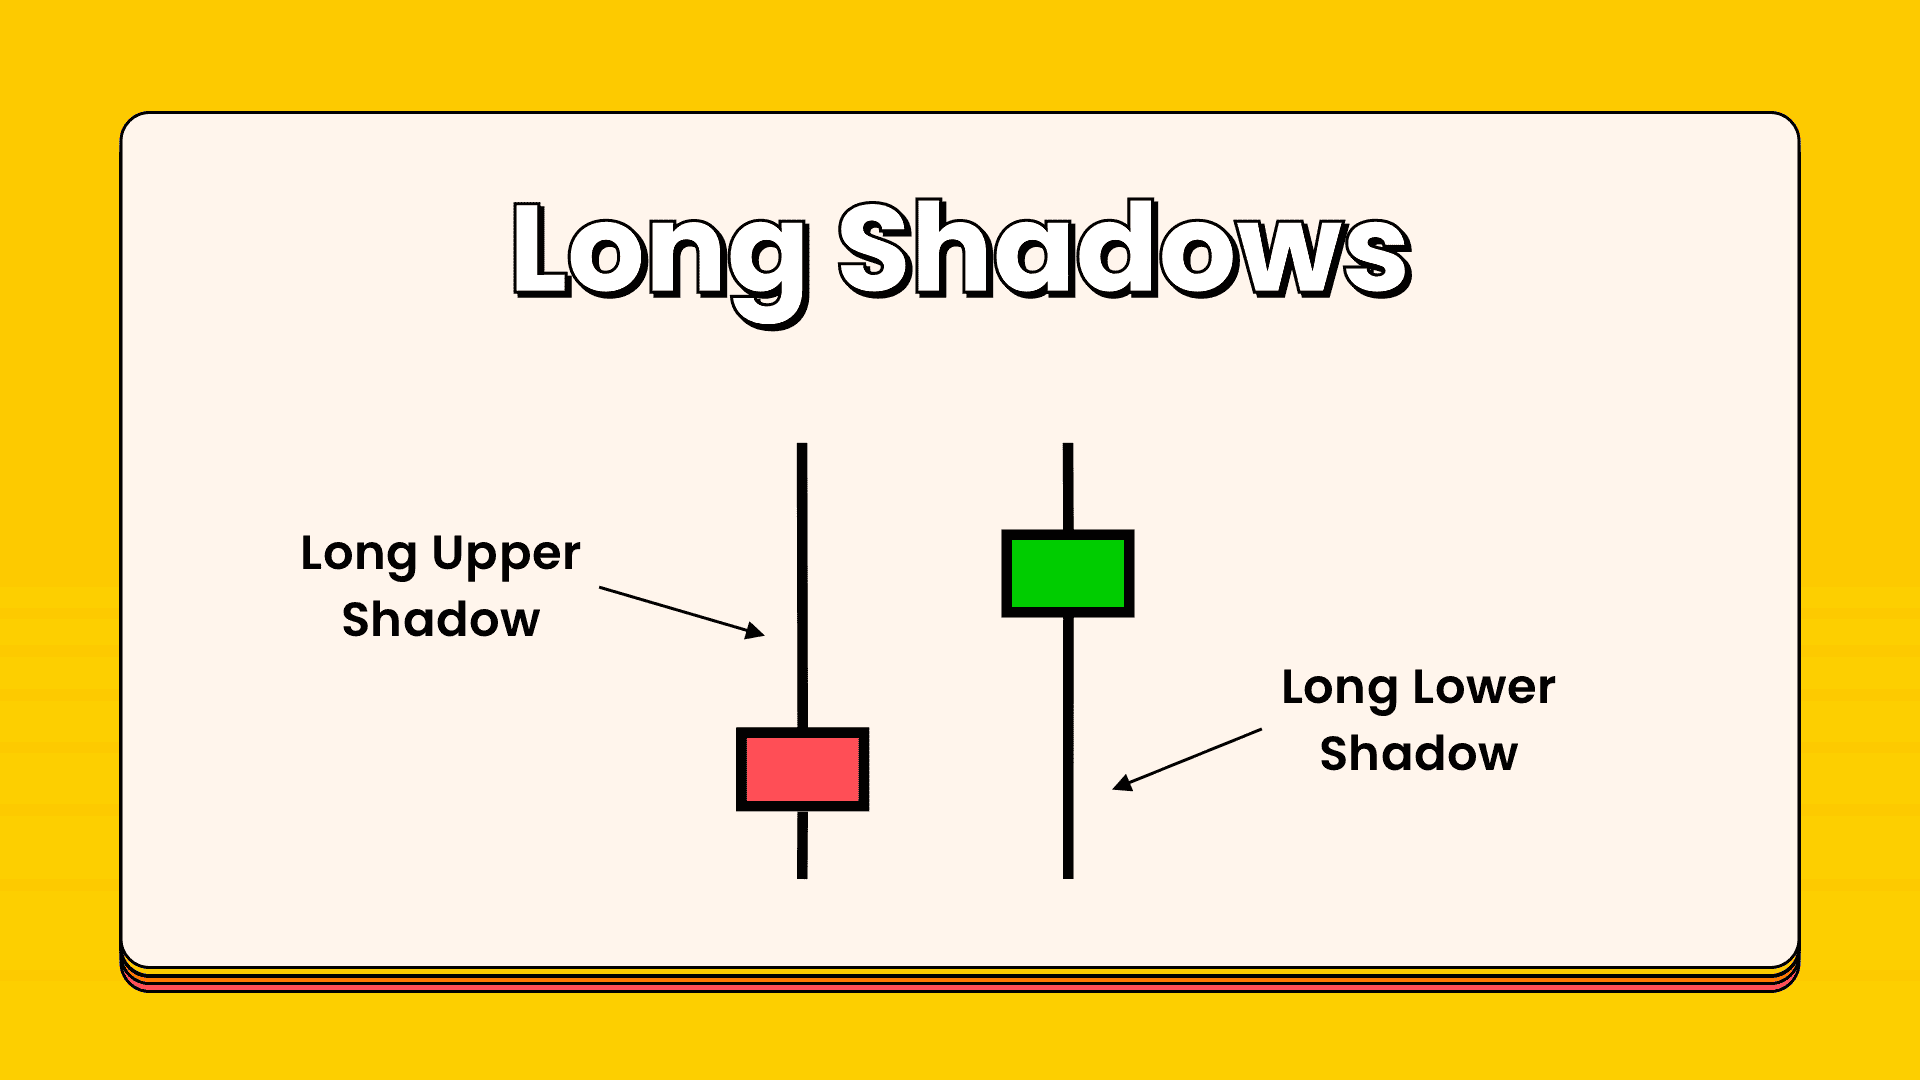
Candlesticks with short shadows indicate that most of the trading action was confined near the open and close. Buyers flex their muscles and bid prices higher if a candlestick has a long upper shadow and a short lower shadow. But for one reason or another, sellers came in and drove the price back down to end the session near its open price.
On the other hand, If a candlestick has a long lower shadow and short upper shadow, sellers flash their washboard abs and force the price lower. But for one reason or another buyer came in and drove prices back up to end the session back near its open price.
Here is Introduction To Candlesticks Basics (Part 2)

Try reading the candlestick on Pocket Trader to get prepared for your next trade! Practice makes profits 😎🔥