USD/CNH Drops Below 7.21000 Mark On Cooler Chinese Inflation Data, U.S. CPI In Focus


Key Takeaways:
- USD/CNH pair moves back below the 7.12000 mark, weighed by fresh Chinese macro data
- Growing Deflation fears as China's consumer prices fall for the first time in 2 years underpin the Yuan and help cap the upside for the USD/CNH cross
- The safe-haven greenback continues to be undermined by a combination of factors
- Focus shifts toward the Key U.S. Inflation data set for release on Thursday
The USD/CNH cross witnessed fresh supply during the mid-Asian session and dragged spot prices to a fresh daily low below the 7.21000 mark, following a modest rebound from the vicinity of the 7.22408 level. The pair has managed to reverse all its earlier gains and looks set to build on its bearish momentum heading into the European session.
A National Bureau of Statistics of China report early today showed China's consumer prices dropped by 0.3% yoy in July, the first decrease since February 2021, compared to a flat reading in June and market estimates of a 0.4% fall. Every month, consumer prices unexpectedly rose by 0.2%, beating forecasts of a 0.1% decrease and marking the first rise in six months. Core consumer prices, excluding food and energy costs, went up 0.8% yoy, the most since January, after a 0.4% gain in June.
On the other hand, China's producer prices fell 4.4% yoy in July 2023, worse than market forecasts of a 4.1% decline after a 5.4% drop in the prior month, which was the steepest decrease since December 2015. Every month, producer prices were down 0.2%, the fourth straight month of decline, following a 0.8% drop in June.
That said, both the CPI and PPI figures are in deflationary territory, which has to a greater extent, reinforced market expectations for additional fiscal stimulus from China to mitigate the challenge, which in turn acts as a tailwind to the Chinese Yuan (CNH) and has helped cap the upside for the USD/CNH pair.
The better-than-expected inflation reports come a day after Chinese Trade Balance data showed China's trade surplus narrowed to USD 80.6 billion in July 2023 from USD 102.7 billion in the same period a year earlier, compared to market forecasts of USD 70.6 billion, as exports fell more than imports amid persistently weak demand from home and abroad. Exports plunged 14.5% yoy, the third straight month of decline and the steepest drop since February 2020, worse than market consensus of a 12.5% drop, while imports fell by 12.4%, the steepest decrease in six months.
Shifting to the U.S. docket, the U.S. trade deficit narrowed to a three-month low of $65.5 billion in June 2023 from a downwardly revised $68.3 billion in May, and roughly in line with market expectations of a $65 billion gap, a U.S. Bureau of Economic Analysis report showed on Tuesday. Imports declined 1% to $313 billion, the lowest level since November of 2021, led by falls in purchases of computers, finished metal shapes, crude oil, artwork and other collectables, gem diamonds and travel. Exports edged down 0.1% to $247.5 billion, the lowest since March last year, dragged down by sales of crude oil, fuel oil, natural gas, pharmaceutical preparations, civilian aircraft, and transport.
That said, the ongoing decline in the U.S. treasury bond yields, along with a weaker risk tone, undermines the safe-haven greenback, which is a key factor acting as a tailwind to the USD/CNH pair. Apart from this, the generally positive tone around the U.S. equity markets continues to underpin the Yuan and could help increase further losses for the USD/CNH pair, at least for now. Moreover, investors' decision to stay on the sidelines ahead of Thursday's key U.S. inflation data report also acts as a headwind to the buck.
As we advance without significant economic news data from both dockets, the broader market risk sentiment and U.S. Treasury bond yields will continue to influence the U.S. dollar and provide short-term trading opportunities around the USD/CNH pair. The focus, however, remains on the key U.S. inflation data set for release on Thursday.
Technical Outlook: Four-Hours USD/CNH Price Chart
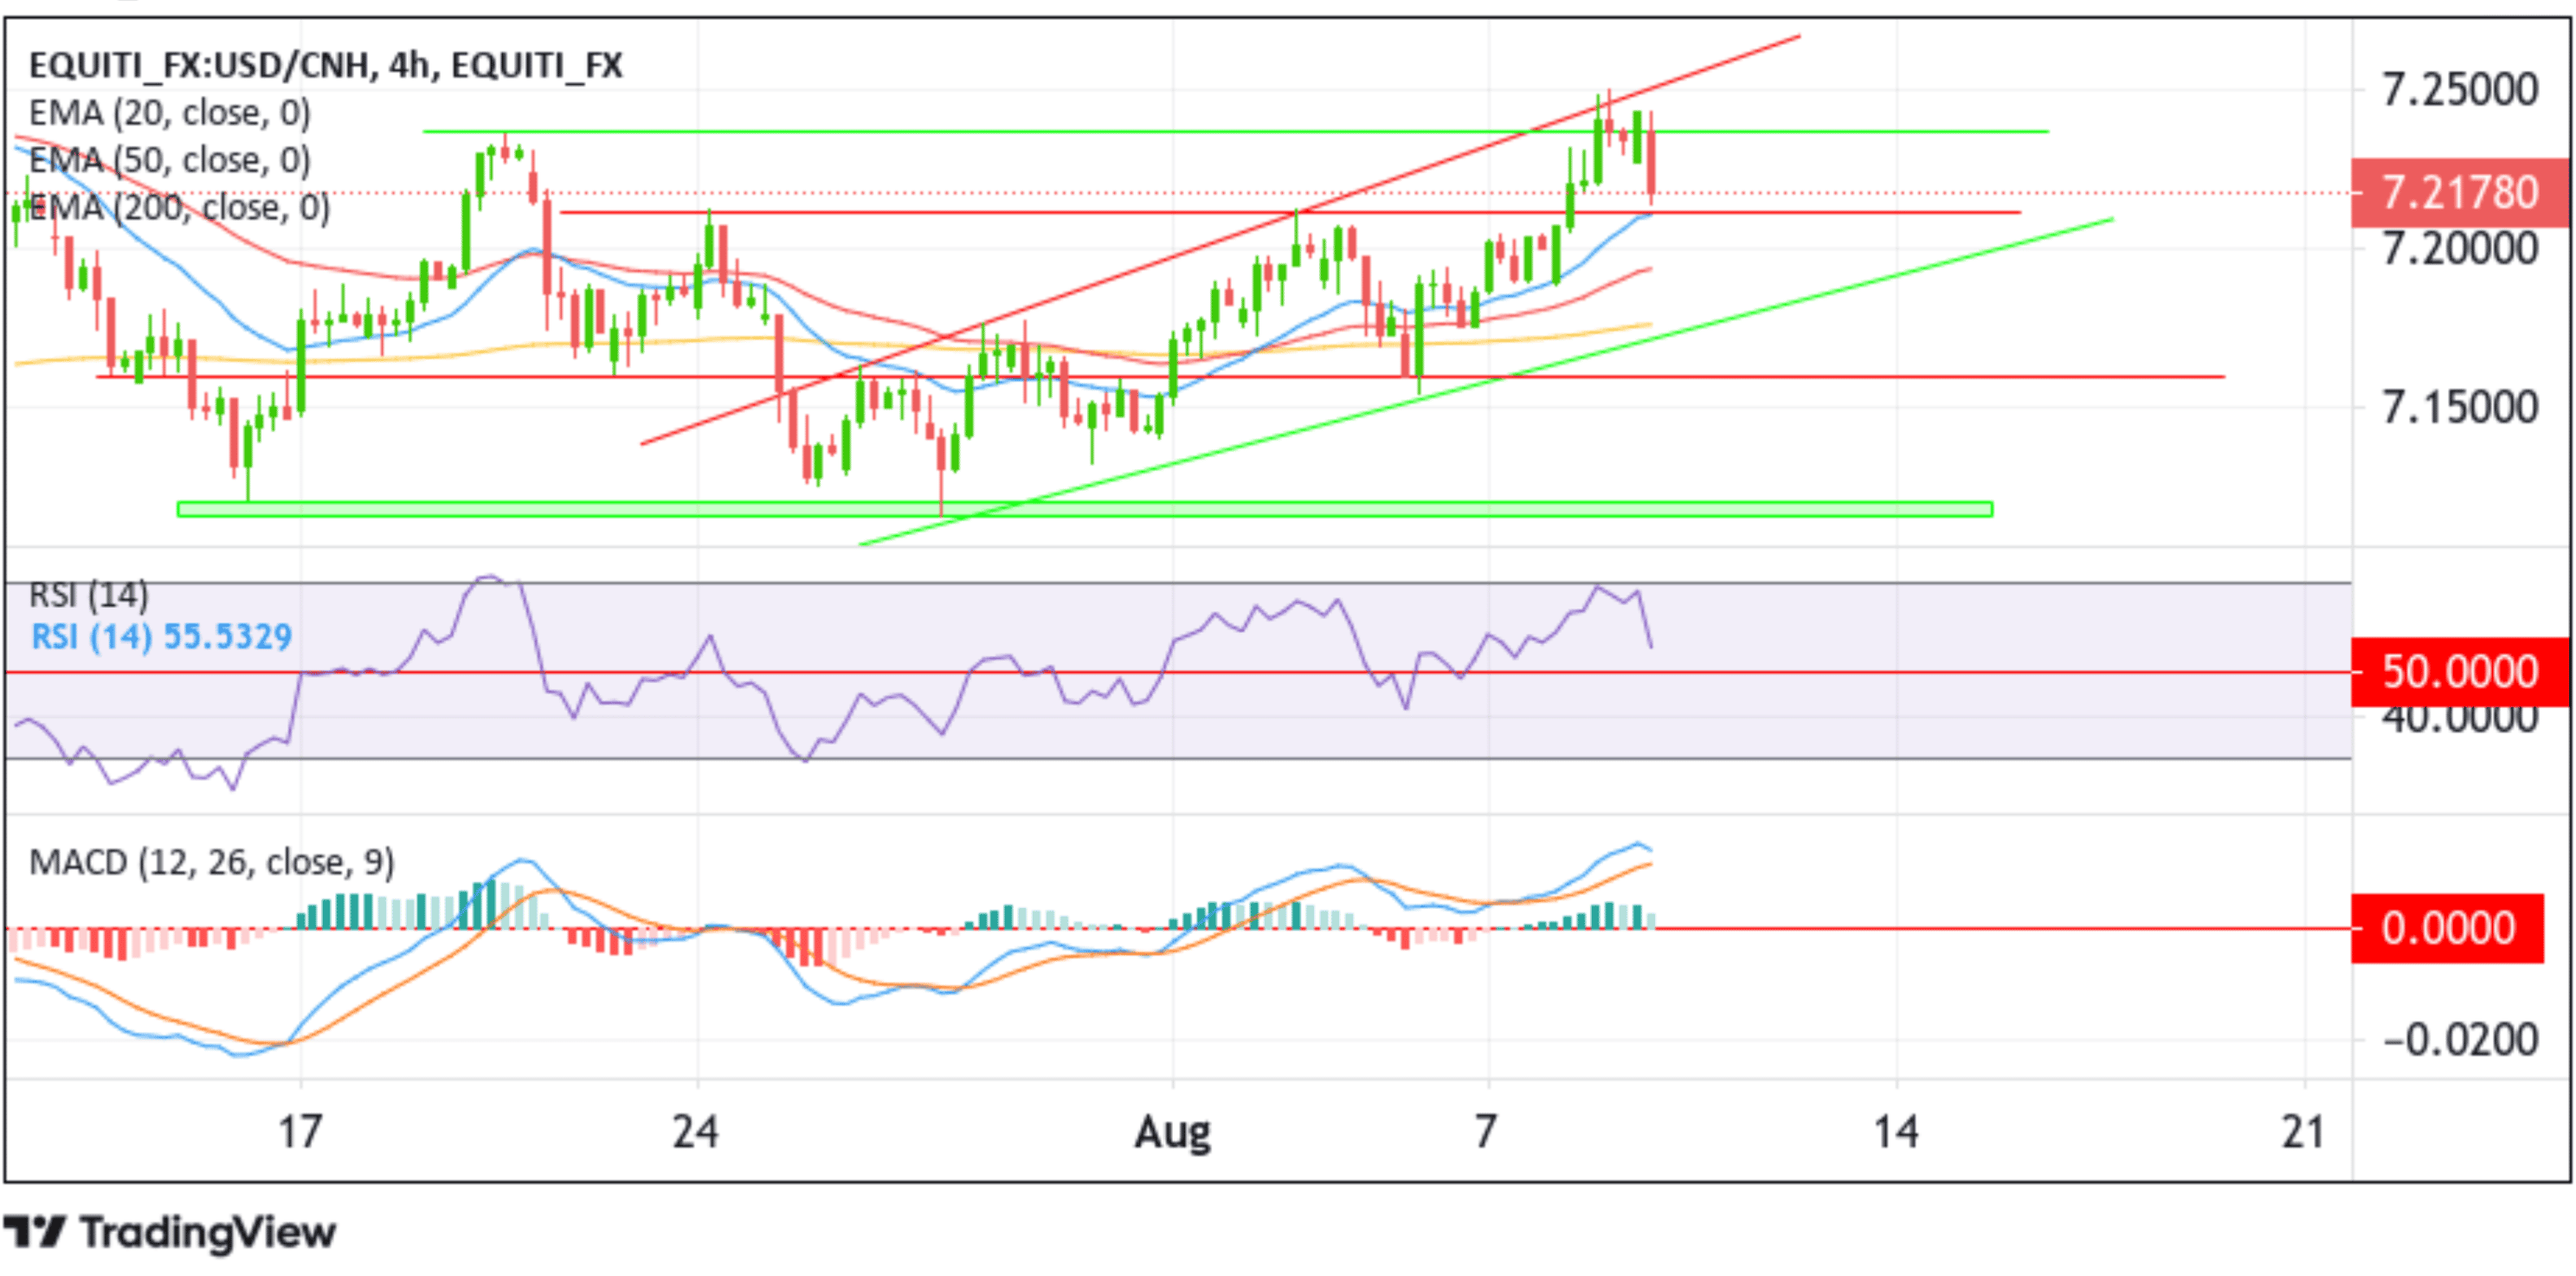
From a technical standpoint, a further increase in selling pressure beyond the current price level will face initial resistance at the 7.21232 support level, about which, if sellers manage to breach this key floor, downside pressure could accelerate, paving the way for the USD/CNH price to tag the 50 (red) and 200 (yellow) days EMA levels at 7.19460 and 7.17573 levels, respectively. Acceptance below these levels would negate the bullish bias and pave the way for aggressive technical selling around the USD/CNH cross. The bearish trajectory could then be extended below the lower limit of the ascending channel pattern extending from the late-July 2023 swing low toward the 7.16002 horizontal level. A subsequent break below this barrier will pave the way for a decline toward the demand zone ranging from 7.12077 - 7.11481 levels. Sustained weakness below this zone will cause the USD/CNH cross more vulnerable, paving the way for further losses.
On the flip side, if dip-buyers and tactical traders jump back in and trigger a bullish reversal, initial resistance appears at the 7.23604 level. Buying interest could gain momentum if the price pierces this barrier, paving the way toward the upper limit of the ascending channel pattern extending from the late-July 2023 swing high. On further strength (bullish price breakout), the focus shifts to the 7.27258 level, followed by the 2023 record high at the 7.28505 level.