UK 100 Futures Index Rises Above £7600.00 Mark As Shrinking Economy Fuels Rate-Cuts Hopes


Key Takeaways:
- The UK 100 futures index rises above the £7600.00 Mark, supported by strength in materials and consumer discretionary stocks
- Disappointing UK GDP data confirms the U.K. economy has fallen into a technical recession
- Croda Intl, Plc. (LON: CRDA) and Imperial Brands, Plc. (LON: M.B.) led the list of top gainers and losers, respectively, before the bell
- Investors await the release of the U.K. retail sales data for further confirmation of the BoE's future policy decision
The U.K.'s blue-chip FTSE 100 futures index inched slightly higher on Friday during the Asian session. It was supported by strength in materials and consumer discretionary stocks as investors continued to digest the latest UK GDP data and its implications for the next Bank of England policy move.
As of press time, futures tied to the UK 100 index rose around 0.26% (19.7 points) to trade at the £7642.1 level. The current price move follows after-hours trading gains to mark a fourth consecutive session of gains as equity markets rose on Thursday, buoyed by retreating U.K. gilt yields after domestic data showed the British economy fell into a recession at the end of 2023, supporting the case for the Bank of England to loosen its restrictive monetary policy stance.

The British economy fell into a technical recession towards the end of 2023 after it shrank by 0.2% year-on-year in the fourth quarter of 2023, the first contraction since 2021, following a downwardly revised 0.2% growth in the previous period. Preliminary estimates showed that it compares to market forecasts of a 0.1% rise.
The immediate market implication of the weaker-than-expected UK GDP data saw U.K. Gilt yields move marginally lower, which weighed on the Great British Pound (GBP) index, which weakened by 0.18% against the greenback. In contrast, the primary index rose by as much as 0.84% to close the day with heavy gains and mark a third day of positive gains in the last five.
That said, the downbeat U.K. G.P. data comes a day after an Office for National Statistics (ONS) report showed both headline inflation and core inflation rate in the U.K. all came better-than-market consensus but remained well above the Bank of England's 2% target, supporting the case that the U.K. central bank could stick to its restrictive monetary policy control for a longer time.

The United Kingdom's inflation rate was unchanged at 4.0% in January 2024, holding close to November's two-year low and falling below the market expectation of 4.2%. However, it remained double the Bank of England's target of 2.0%. The annual core inflation rate, which excludes volatile items such as energy and food, held steady at 5.1%, slightly below the market consensus of 5.2%
These, plus the robust U.K. wage data released earlier this week, thoroughly pour cold water on the idea of aggressive early rate cuts.
UK FTSE 100 Index Movers
Here are the top UK FTSE 100 index movers today before the bell, a week in which the primary index is on course to finish with modest gains.
Top Gainers⚡
Croda Intl, Plc. (LON: CRDA) rose 3.2%/61.50 points to trade at £1830.50 per share.
Kingfisher Plc. (LON: KGF) added 3.02%/6.60 points to trade at £225.10 per share.
Fresnillo, Plc. (LON: FRES) gained 2.66%/12.40 points to trade at £478.90 per share.
Top Losers💥
Imperial Brands, Plc. (LON: M.B.) lost 2.34%/60.00 points to trade at £2501.00 per share.
Pershing Square Holdings, Ltd. (LON: ADML) declined 1.70%/66.00 points to trade at £3828.00 per share.
B.P., Plc. (LON: B.P.) shed 1.63%/7.75 points to trade at £468.75 per share.
As we advance, investors look forward to releasing U.K. retail sales data, which, together with the general market risk sentiment, will help determine the primary index's next leg of a directional move.
Technical Outlook: Four-Hour UK 100 Index Price Chart

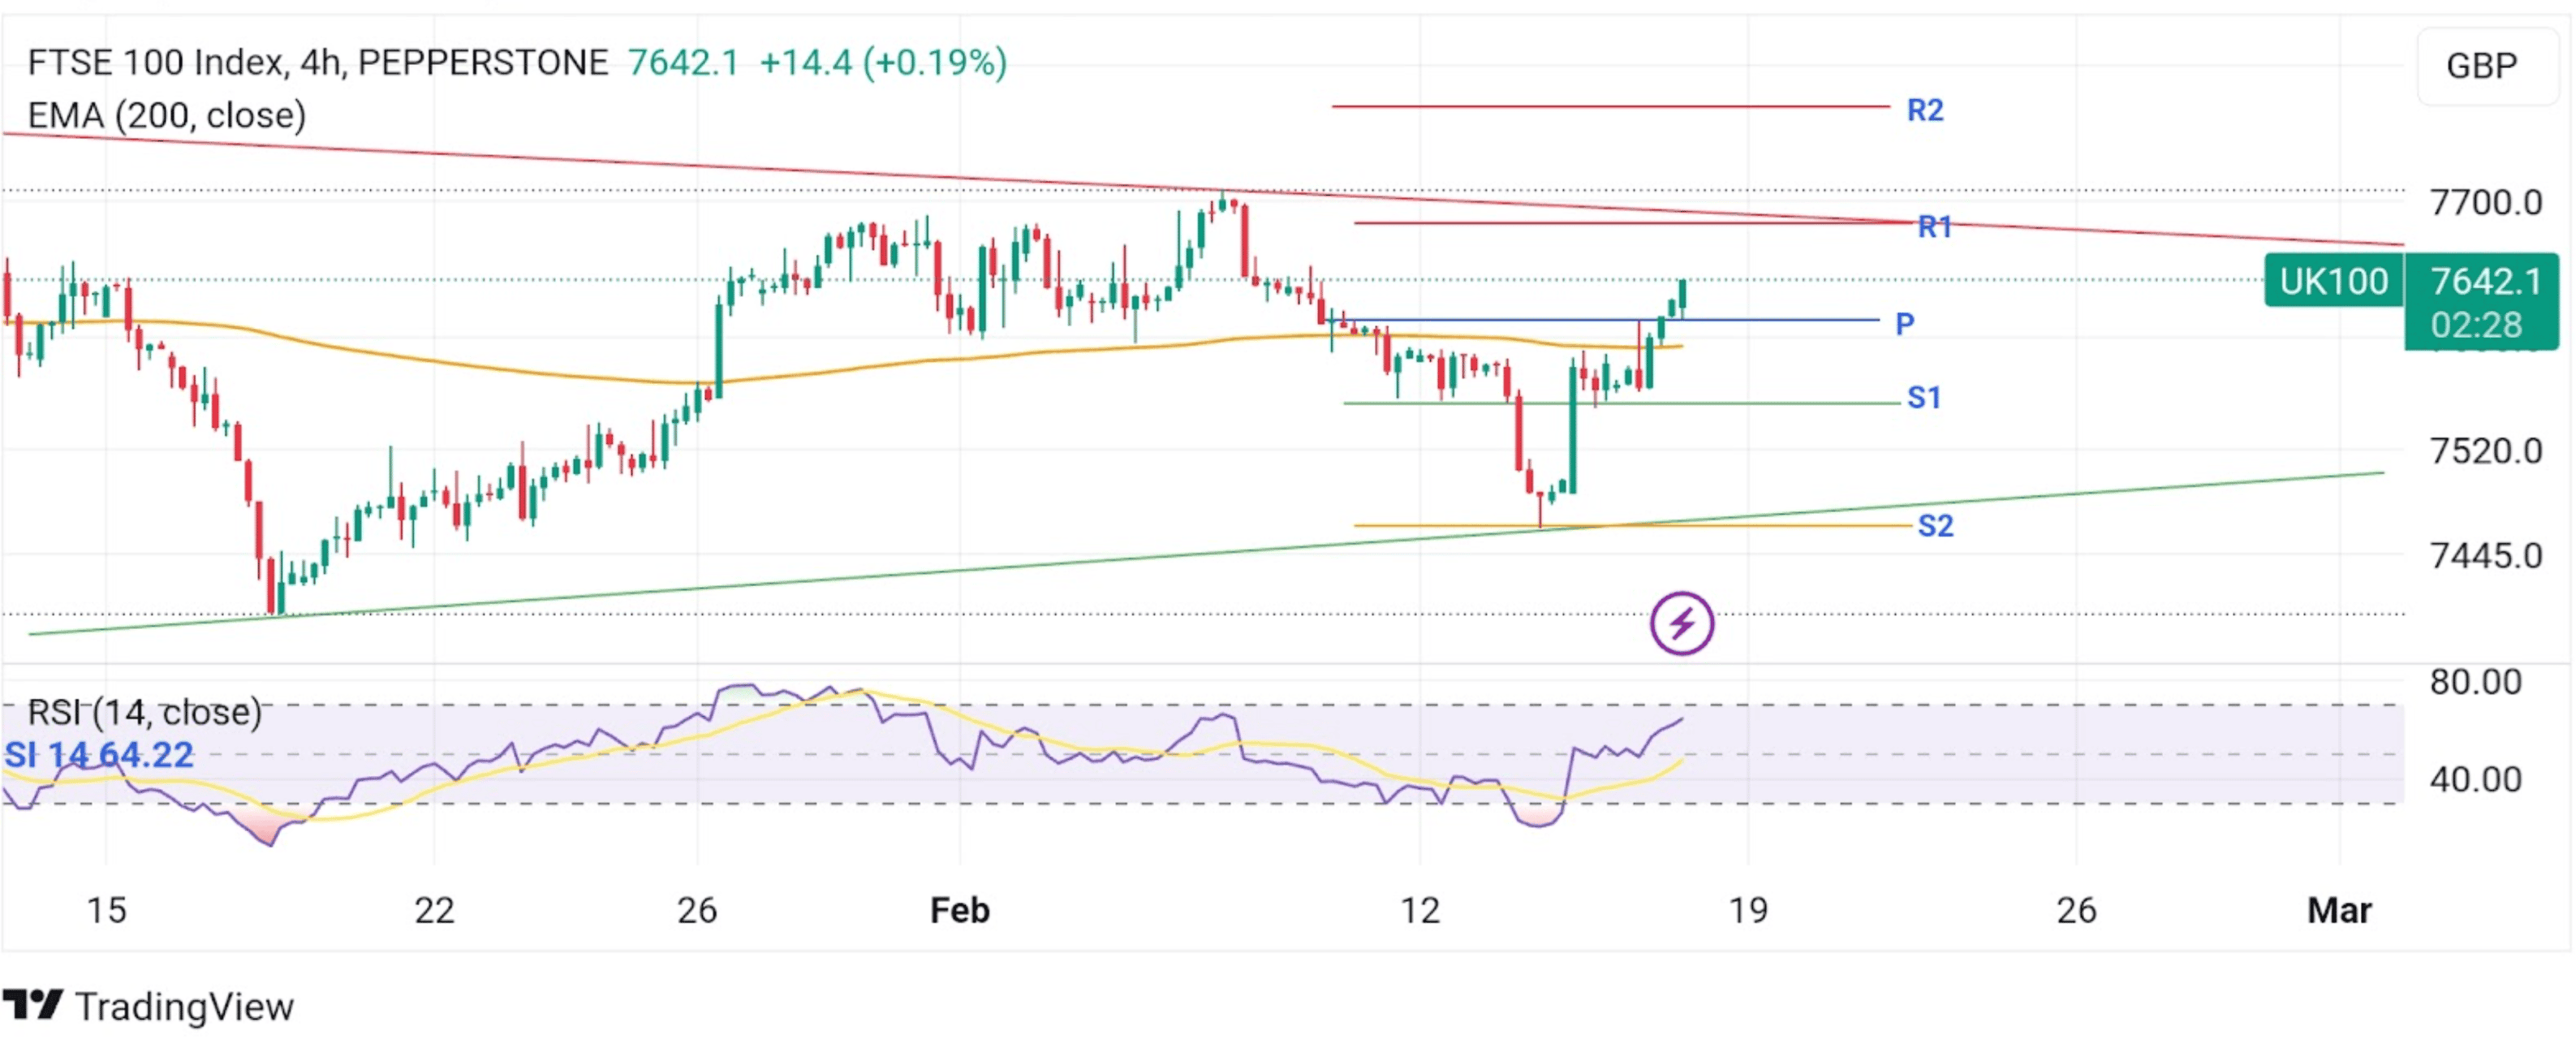
From a technical perspective, the primary index price's ability to find acceptance above the technically strong 200 Exponential Moving Average (EMA) at £7593.9 and the subsequent move above the pivot level (P) at £7613.1, which coincides with the 61.8% Fibonacci retracement of the 8th February to 15th February recovery, favors buyers and supports the case for further buying. A further increase in buying momentum from the current price level will uplift spot prices toward the 7686.3 level (R1), which would act as a barrier toward the index against further uptick. However, a convincing move above this level will pave the way for a further rise toward the multi-week descending trendline, about which, if the price pierces above this level, buying interest could gain further momentum, paving the way for a rally toward the 7768.9 resistance level (R2), which if cleared decisively, would set the stage for a further near-term appreciating move toward the 7800.00 round mark.
On the flip side, the £7613 level now seems to protect the immediate downside. Sustained weakness below would see the primary index accelerate the slide toward the 7552.7 support level (S1). A clean move below this level would turn the primary index vulnerable to a drop toward the multi-week ascending trendline. A subsequent break below this key support level would reaffirm the bearish bias and pave the way for further selling around the primary index.


