USTECH 100 Futures Index Eases From Monthly Peak On Post US GDP Data Report Release


- USTECH 100 Futures Index retreated from its monthly peak amid a renewed U.S. Dollar Buying
- U.S. GDP rose 2.9% in the fourth quarter, more than expected, even as recession fears loom
- Tesla reports record revenue and beats
- Microsoft offers lacklustre guidance, says new business growth slowed in December
USTECH 100 Futures Index retreated on Friday from the monthly high/12044.46 level after finishing higher in the previous trading session as traders assessed the latest batch of corporate earnings and fourth-quarter gross domestic product that came in above expectations.
As per press time, the tech-heavy USTECH 100 Futures Index is down 0.17% to trade at 11977.42 amid renewed U.S. Dollar Demand across the board. The U.S. Dollar index (DXY), which measures the value of the United States Dollar relative to a basket of foreign currencies, was up 0.15% to trade at 101.871 as of 05:30 (UTC+3) despite shedding off some gains. After an initial rally that was sparked after data showed the U.S. economy maintained a strong pace of growth in the fourth quarter, backing the case for the U.S. Federal Reserve to maintain its hawkish stance for longer.
Gross domestic product increased at a 2.9% annualized rate last quarter, the Commerce Department said in its advance fourth-quarter GDP growth estimate. The economy grew at a 3.2% pace in the third quarter. Economists polled by Reuters had forecast GDP rising at a 2.6% rate. A separate report from the Labor Department showed initial claims for state unemployment benefits dropped 6,000 to a seasonally adjusted 186,000 for the week ended Jan. 21.
Commenting on the reports, "A somewhat mixed picture painted by the U.S. data," said Stuart Cole, head macroeconomist at Equiti Capital in London. Cole said that the data point to an economy continuing to show resilience in the face of the rapid monetary tightening delivered by the Fed. "But a big contributor to this growth story was inventories, a component that is almost certain to weaken as we go through 2023," he said.

Tesla reports record revenue and beats on earnings
Electric vehicle maker Tesla (NASDAQ: TSLA) reported earnings after the bell, beating on earnings and revenue. Shares rose more than 5% after hours after CEO Elon Musk said the company might be able to produce 2 million cars this year. Here are the results.
- Earnings (adjusted): $1.19 vs $1.13 per share expected, per Refinitiv
- Revenue: $24.32 billion vs $24.16 billion expected, per Refinitiv

In the year-ago quarter, Tesla reported revenue of $17.72 billion and adjusted earnings of $2.52 per share ($0.85 adjusted for an August 2022 stock split). Tesla reported automotive revenue of $21.3 billion in the fourth quarter, representing 33% growth year-over-year. $467 million came from regulatory credits in the fourth quarter of 2022, up nearly half from the prior year in the same period.
Microsoft offers lacklustre guidance, says new business growth slowed in December
Microsoft (NASDAQ: MSFT) issued a disappointing revenue forecast for the current quarter in its earnings call on Tuesday, causing a reverse in the stock price after the shares initially rallied on better-than-expected earnings for the December quarter.
The technology company saw a drop off in business at the end of 2022 in core Windows and Office areas, CEO Satya Nadella told analysts on a conference call.
Here's how the company did:
- Earnings: $2.32 per share, adjusted, vs $2.29 per share as expected by analysts, according to Refinitiv.
- Revenue: $52.75 billion, vs $52.94 billion as expected by analysts, according to Refinitiv.

Microsoft called for $50.5 billion to $51.5 billion in fiscal third-quarter revenue, which works out to 3% implied growth, while analysts polled by Refinitiv had expected $52.43 billion. Amy Hood, the finance chief, said the P.C. market would contract again, leading to a roughly 17% year-over-year decline in the More Personal Computing business segment that features Windows.
Going forward, In the USTECH 100 Index, the best-performing sector on Friday was the consumer discretionary sector led by Tesla Inc (NASDAQ: TSLA), which rose 10.97%/15.84 points to trade at $160.27 per share. The Information Technology sector was followed second, led by Datadog Inc (NASDAQ: DDOG), which added 7.42%/5.25 points to trade at $76.00 per share.
On the other hand, the worst-performing sector was the Industrials sector, led by CSX Corporation (NASDAQ: CSX), which lost 2.90%/0.90 points to trade at $30.15 per share. The Consumer Staples sector came in second, topped by PepsiCo Inc (NASDAQ: PEP), which declined 0.99%/1.71 points to trade at $170.22 per share.
Technical Outlook: Four-Hours USTECH 100 Price Chart
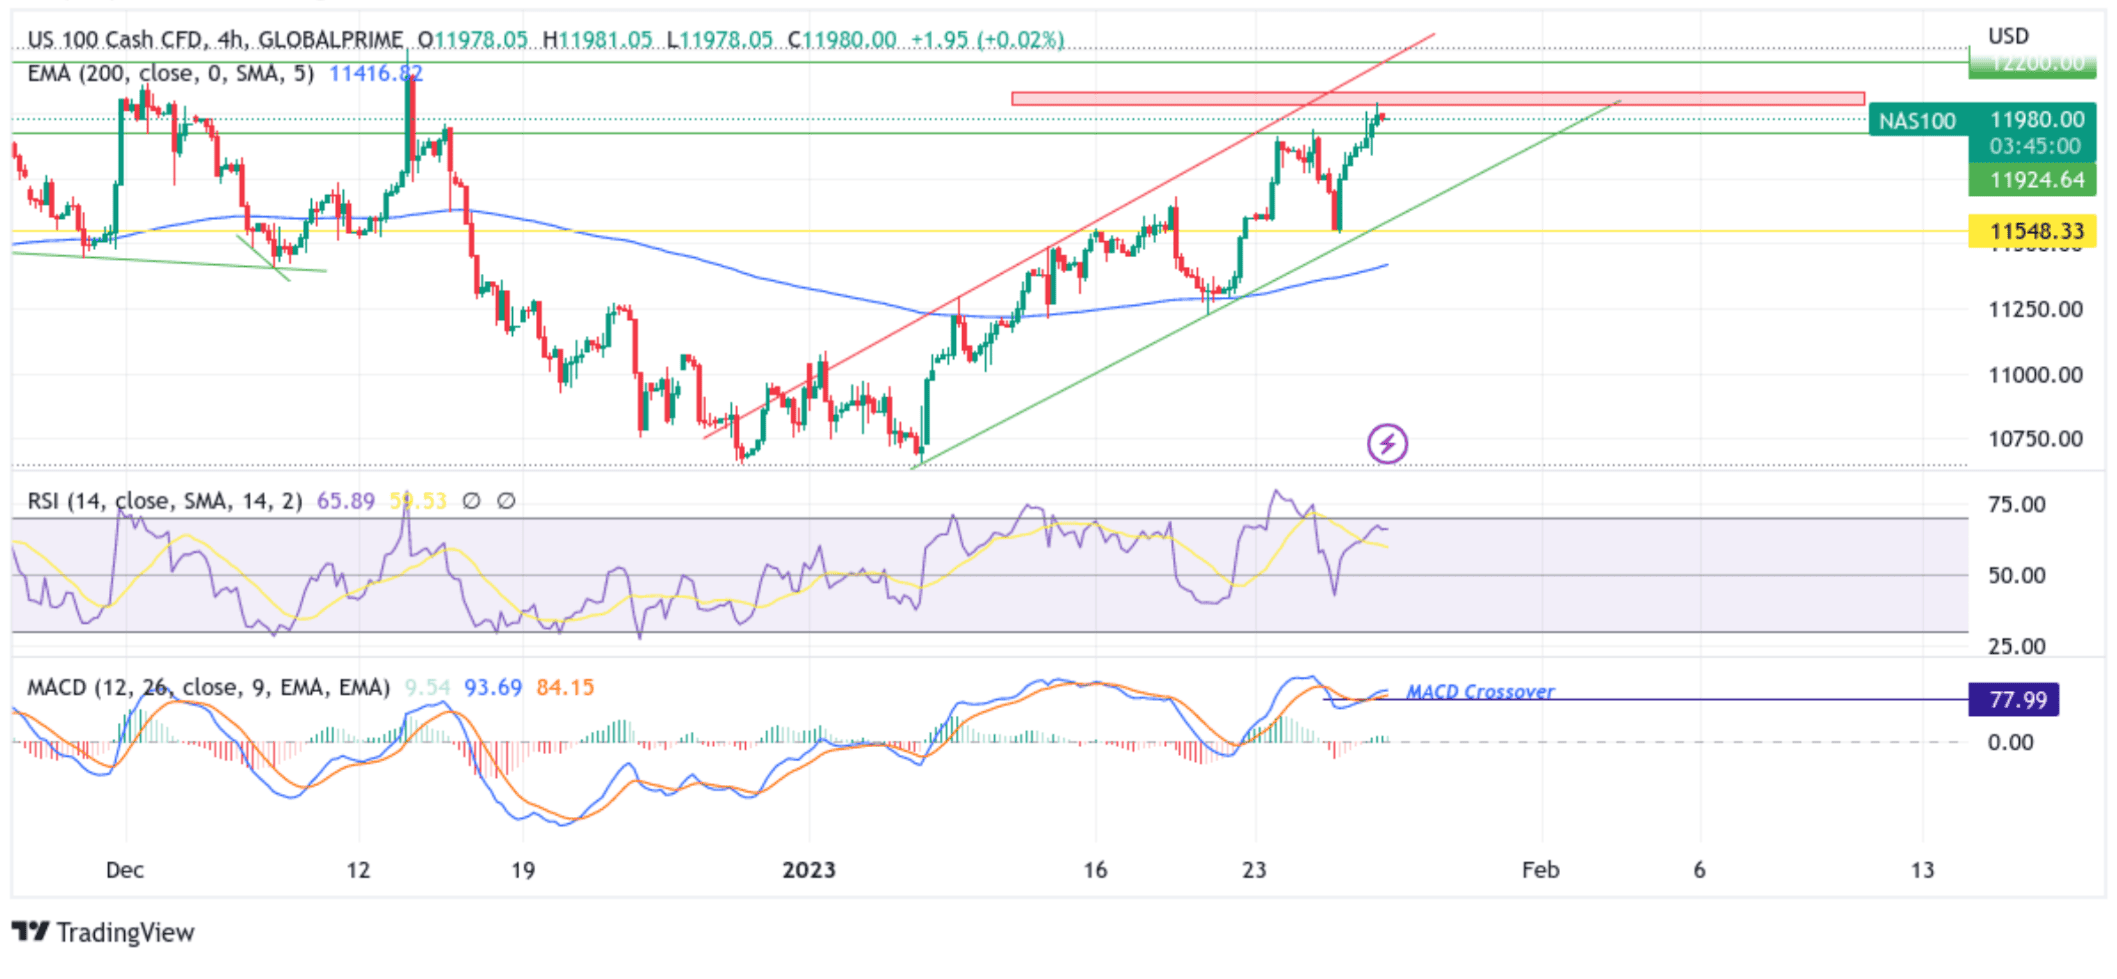
USTECH 100 Futures Index has been trading within an ascending channel pattern since the beginning of this year. It has shown no sign of bullish trajectory exhaustion heavily supported by a move above the 200 Exponential Moving Average (EMA). As per press time, the price has extended the modest rebound (firm rejection) from a key supply zone ranging from 12030.49 - 12080.44 levels. Some follow-through selling would drag spot prices towards the 50% and 61.8 & Fibonacci retracement levels at 11792.24 and 11732.57 levels, respectively. The aforementioned Fib levels would act as a barrier toward the USTECH 100 Futures Index against further downtick. However, sustained weakness below these levels would pave the way for aggressive technical selling. The downward trajectory could then accelerate toward retesting the key support level (the lower trendline of the ascending channel pattern extending from the early January 2023 swing low). If sellers manage to breach this floor, it will pave the way for additional losses around the USTECH 100 Futures Index.
All the technical oscillators are in positive territory suggesting the downtick could be short-lived. The RSI (14) is at 65.89 and above the signal line, portraying a bullish filter. On the other hand, the Moving Average Convergence Divergence (MACD) Crossover is also above the signal line, pointing to a bullish sign for price action. Additionally, acceptance above the 200 (blue) Exponential moving average at the 11415.98 level adds credence to the bullish bias.
On the flip side, if dip-buyers and tactical traders jump back in and trigger a bullish turnaround, the initial resistance appears at the key supply zone ranging from 12030.49 - 12080.44 levels. If the price pierces this barrier, buying interest could gain momentum, creating the right conditions for an advance toward retesting the key resistance level (the upper trendline of the ascending channel pattern extending from the early January 2023 swing high). Sustained strength above this level would pave the way for additional gains around the USTECH 100 Futures Index.