AUD/CAD Retreats From Multi-Month Peak, Further Dowtick Seems Elusive Amid Bets For Further Rate Hikes


- Since August, AUD/CAD has trimmed some of its solid intraday gains to the highest level
- Oil edges up as U.S. crude inventories rise less than expected, in turn, underpins the Loonie
- BoC raises rate and signals end of tightening
- Bets for further rate hikes by the RBA should limit any deeper pullback for the pair amid hotter-than-expected Australia inflation data

The AUD/CAD pair climbed to a fresh six-week high, around the 0.95720 - 0.95275 region during the early Asian session, albeit quickly retreated a few pips after that. The pair was last seen trading just a few pips below the 0.95200 mark.
A combination of factors has assisted the AUD/CAD pair in rebounding from the YTD high and gained some follow-through selling, snapping the seven-day winning streak. A firm tone around crude oil prices underpinned the commodity-linked Loonie. This, along with a fragile market sentiment amid worries about the economic headwinds stemming from the worst yet COVID-19 outbreak in China, acted as a headwind toward the Aussie dollar. Apart from this, the protracted Russia-Ukraine war has been fueling recession fears and tempers investors' appetite for perceived riskier assets.

Crude inventories rose by 533,000 barrels to 448.5 million barrels in the week ending Jan. 20, the Energy Information Administration (EIA) said. That was substantially short of forecasts for a 1 million barrel rise. The EIA said that despite the smaller-than-expected crude build, crude stocks reached the highest level since June 2021.
Further limiting the Loonie was the news that the Bank of Canada had pivoted. The Bank of Canada raised its base interest rate by 25 basis points to 4.5% and said it was time to pause the rate hiking cycle to assess its impact on the economy. Following the announcement, the Canadian Dollar reacted to the decision and associated guidance by falling against most of its peers.
The Bank of Canada (BOC) said that the interest rate hike was justified by recent economic growth, which has been stronger than expected and an economy that remains in excess demand. "Labor markets are still tight: the unemployment rate is near historic lows, and businesses report difficulty finding workers. However, there is growing evidence that restrictive monetary policy is slowing activity, especially household spending," the statement said.
The Bank estimates Canada's economy will grow by 3.6% in 2022, slightly more robust than was projected in October. Growth is expected to stall through the middle of 2023, picking up later in the year. The Bank expects GDP growth of about 1% in 2023 and about 2% in 2024, little changed from the October outlook.

Shifting to the Australian docket, an inflation data report released on Wednesday showed inflation in Australia in the last quarter of 2022 jumped to the highest level since 1990. The annual inflation rate in Australia climbed to 7.8% in Q4 of 2022 from 7.3% in Q3 and above market forecasts of 7.5%. This was the highest print since Q1 1990, boosted by rising food costs, automotive fuel, and new dwelling construction. Following the report, the Aussie dollar rose 0.53% against the Loonie, hitting its highest levels over five months. The data report supports the case for further Reserve bank of Australia policy tightening. This, in turn, should limit the downside for the AUD/CAD pair. Hence, any subsequent pullback is still seen as a buying opportunity, warranting some caution for bearish traders in the absence of any relevant market-moving economic releases from the Canadian docket.
Technical Outlook: Four-Hours AUD/CAD Price Chart
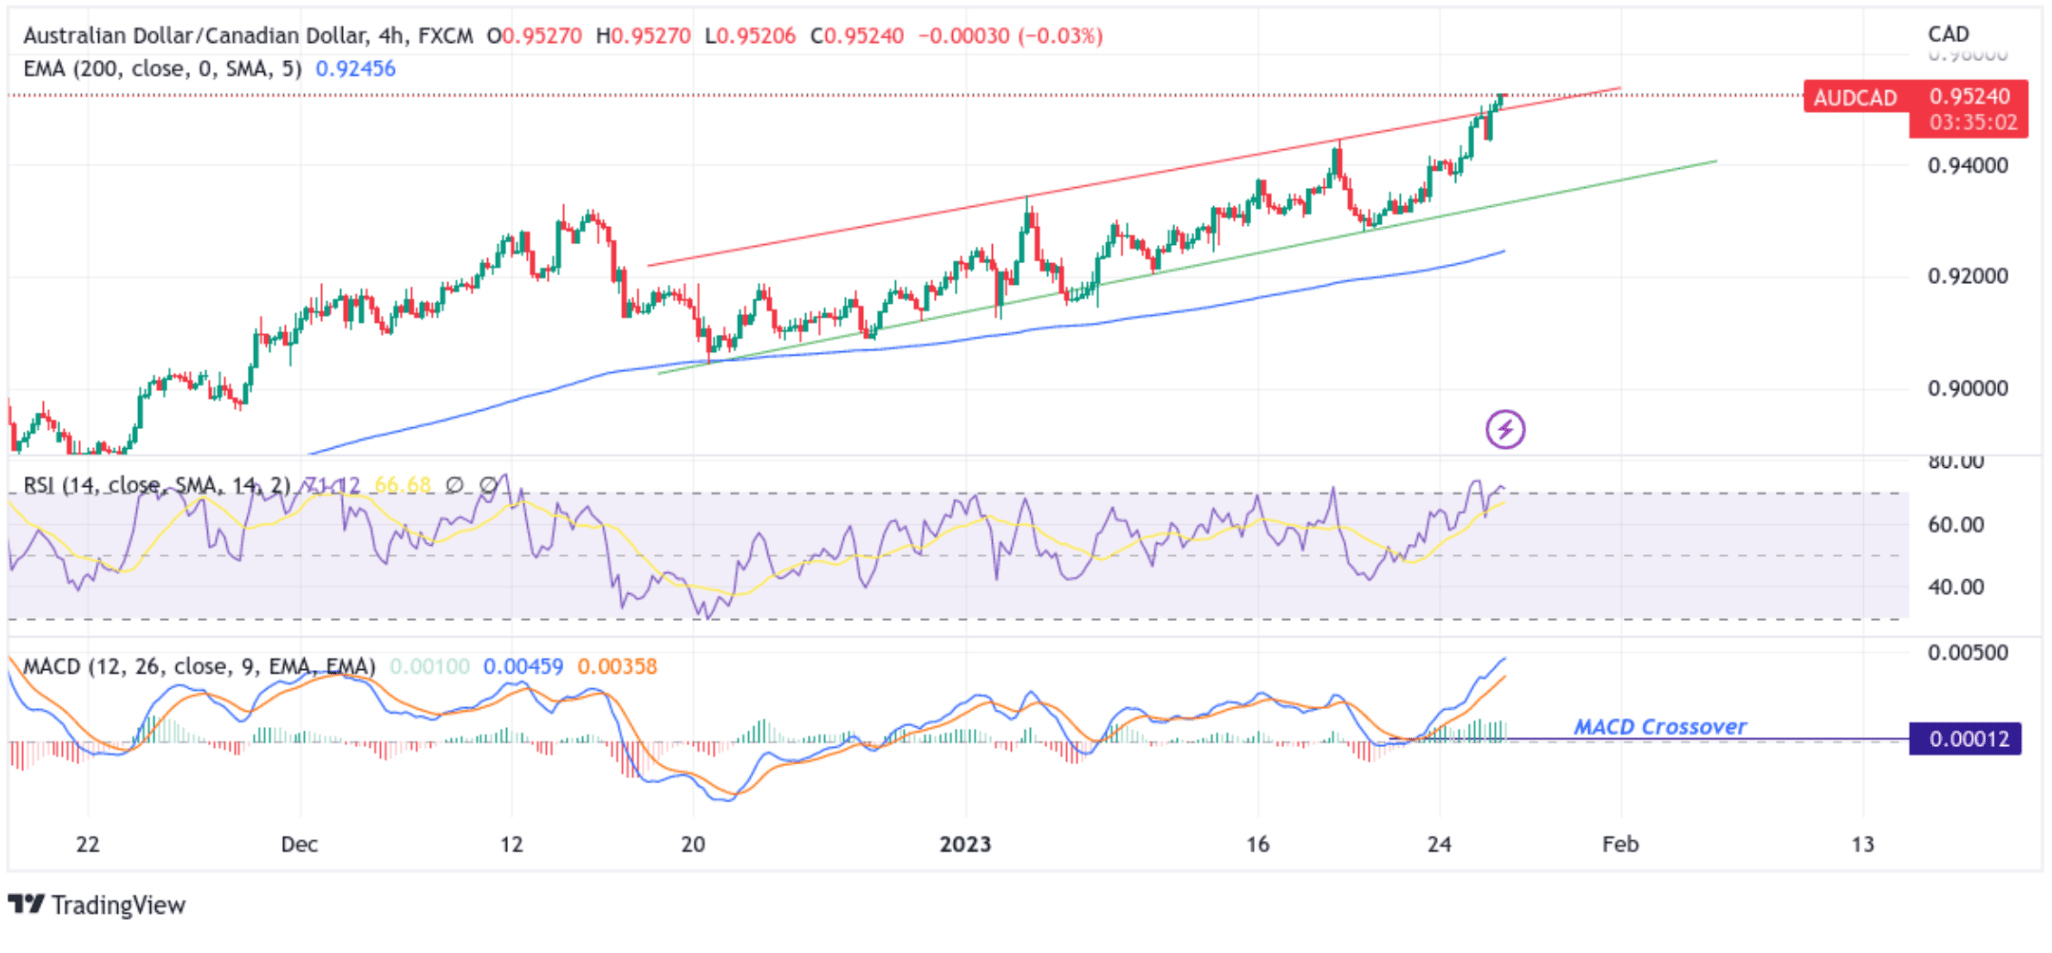
From a technical standstill, the price has rebounded from the vicinity of 0.95720 level after a move beyond the previous YTD top, at around the 0.95052 level, confirming a bullish breakout and support prospects for additional gains. Some follow-through selling would drag spot prices toward the upper trendline of the ascending channel pattern (now turned support level) plotted from Jan. 4, 2023, and swing to higher highs. Sustained weakness below the aforementioned support level would negate any near-term bullish outlook and pave the way for aggressive technical selling.
All the technical oscillators are in positive territory, with the RSI (14) at 71.12 above the signal line and flashing oversold conditions, signalling a further downside move that could play out in the coming session and warrants caution to traders against submitting aggressive bullish bets. On the other hand, the Moving Average Convergence Divergence (MACD) Crossover is also above the signal line, pointing to a bullish sign for price action this week. Still, a move below the signal would change the bullish narrative.
On the flip side, if dip-buyers and tactical traders jump back in and trigger a bullish turnaround, the initial resistance appears 0.95293 resistance level. If the price pierces this barrier, buying interest could gain momentum, creating the right conditions for an advance toward May 2018 low and May 2021 ceiling at 0.95551 level.