AUD/CAD Eases Below 0.92700s Amid Rebounding Oil Prices


- AUD/CAD Cross attracts fresh selling on Monday and drops below the 0.92700s level
- Rebounding Crude Oil Prices Underpinned the Loonie
- A slew of mixed Australian Economic News data undermined the Aussie dollar and exerted downward pressure on the AUD/CAD pair

AUD/CAD Cross met fresh supply on the first day of the week and rebounded modestly from the vicinity of 0.92748 level amid rebounding global oil prices. As per press time, the shared currency is down over 30 pips for the day and looks to maintain its offered tone heading into the European Session.
Crude Oil Prices Slumped last week as growing recession fears negated any supply woes after weak economic data from China, Europe, and the United States. However, Crude oil prices found some support and rose more than 1% earlier in the session today after Russian President Vladimir Putin said the world's biggest energy exporter could cut output in response to a price cap on its crude oil exports. This was in response to the planned price cap on Russian oil by the Group of seven (G7) and the European Union that took effect on December 5th. News of China easing its Covid Curbs also supported crude oil prices.
The Bank of Canada (BOC) last week on Wednesday hiked its benchmark overnight interest rate by 50 basis points to 4.25%, the highest level in almost 15 years, and signalled the tightening campaign was near an end.
The central bank, which has raised rates at a record pace of 400 basis points in nine months, cited still-strong growth and tight labor markets as the reason for the latest increase.
But it eliminated the forward guidance it has used since the start of the tightening cycle, dropping language that said rates would have to rise further.

"Looking ahead, Governing Council will be considering whether the policy interest rate needs to rise further to bring supply and demand back into balance and return inflation to target," the bank said in a statement.
In other news, Canada posted a trade surplus of CAD 1.2 billion in October of 2022, widening from a downwardly revised CAD 0.6 billion in the previous month and line with market expectations. Exports rose by 1.5 percent to CAD 67 billion, with growth observed in 8 out of 11 industries accounted for. The combination of positive factors supported the Loonie and exerted downward pressure on the AUD/CAD pair.
Shifting on to the Australian docket, the Aussie dollar was supported by the news of China's inflation data coming in line with market expectations. China's annual inflation fell to 1.6% YoY in November 2022 from 2.1% in the prior month, matching market consensus. This was the lowest figure since March, mainly due to a sharp slowdown in the cost of food (3.7% vs 7.0% in October) as pork prices eased further after authorities released national reserves into the market. Additionally, news that China's Economic growth will keep pace with the implementation of the newly-announced anti-COVID adjustment measures. State media CCTV quoted Premier Li Keqiang saying last Thursday was another factor that underpinned the Aussie Dollar.

Further lifting the Aussie dollar was the news of the Reserve Bank of Australia raising its cash rate by 25bps to 3.1% at its final meeting of 2022, matching market forecasts. In other news, Australia's trade surplus declined to AUD 12.22 billion in October 2022 from September's three-month high of AUD 12.44 billion, compared with market forecasts of an AUD 12.1 billion surplus, amid weakening global demand. Exports fell 0.9% from a month earlier to AUD 60.07 billion, while imports dropped at a softer 0.7% to AUD 47.85 billion. Additionally, a rebound in the Asian equity markets on Monday as investors looked ahead to a Fed meeting and U.S. inflation data this week weighed on the Aussie dollar. It was seen as a factor that exerted downward pressure on the AUD/CAD pair. That said, the mixed economic news data were seen as factors that drove flows away from the Aussie dollar toward the Loonie.
As we advance, investors now look forward to the Canadian docket featuring Bank of Canada (BOC) Governor Tiff Macklem's speech for clues regarding future monetary policy. His comments may determine a short-term positive or negative trend around the AUD/CAD pair.
Technical Outlook: One-Day AUD/CAD Price Chart
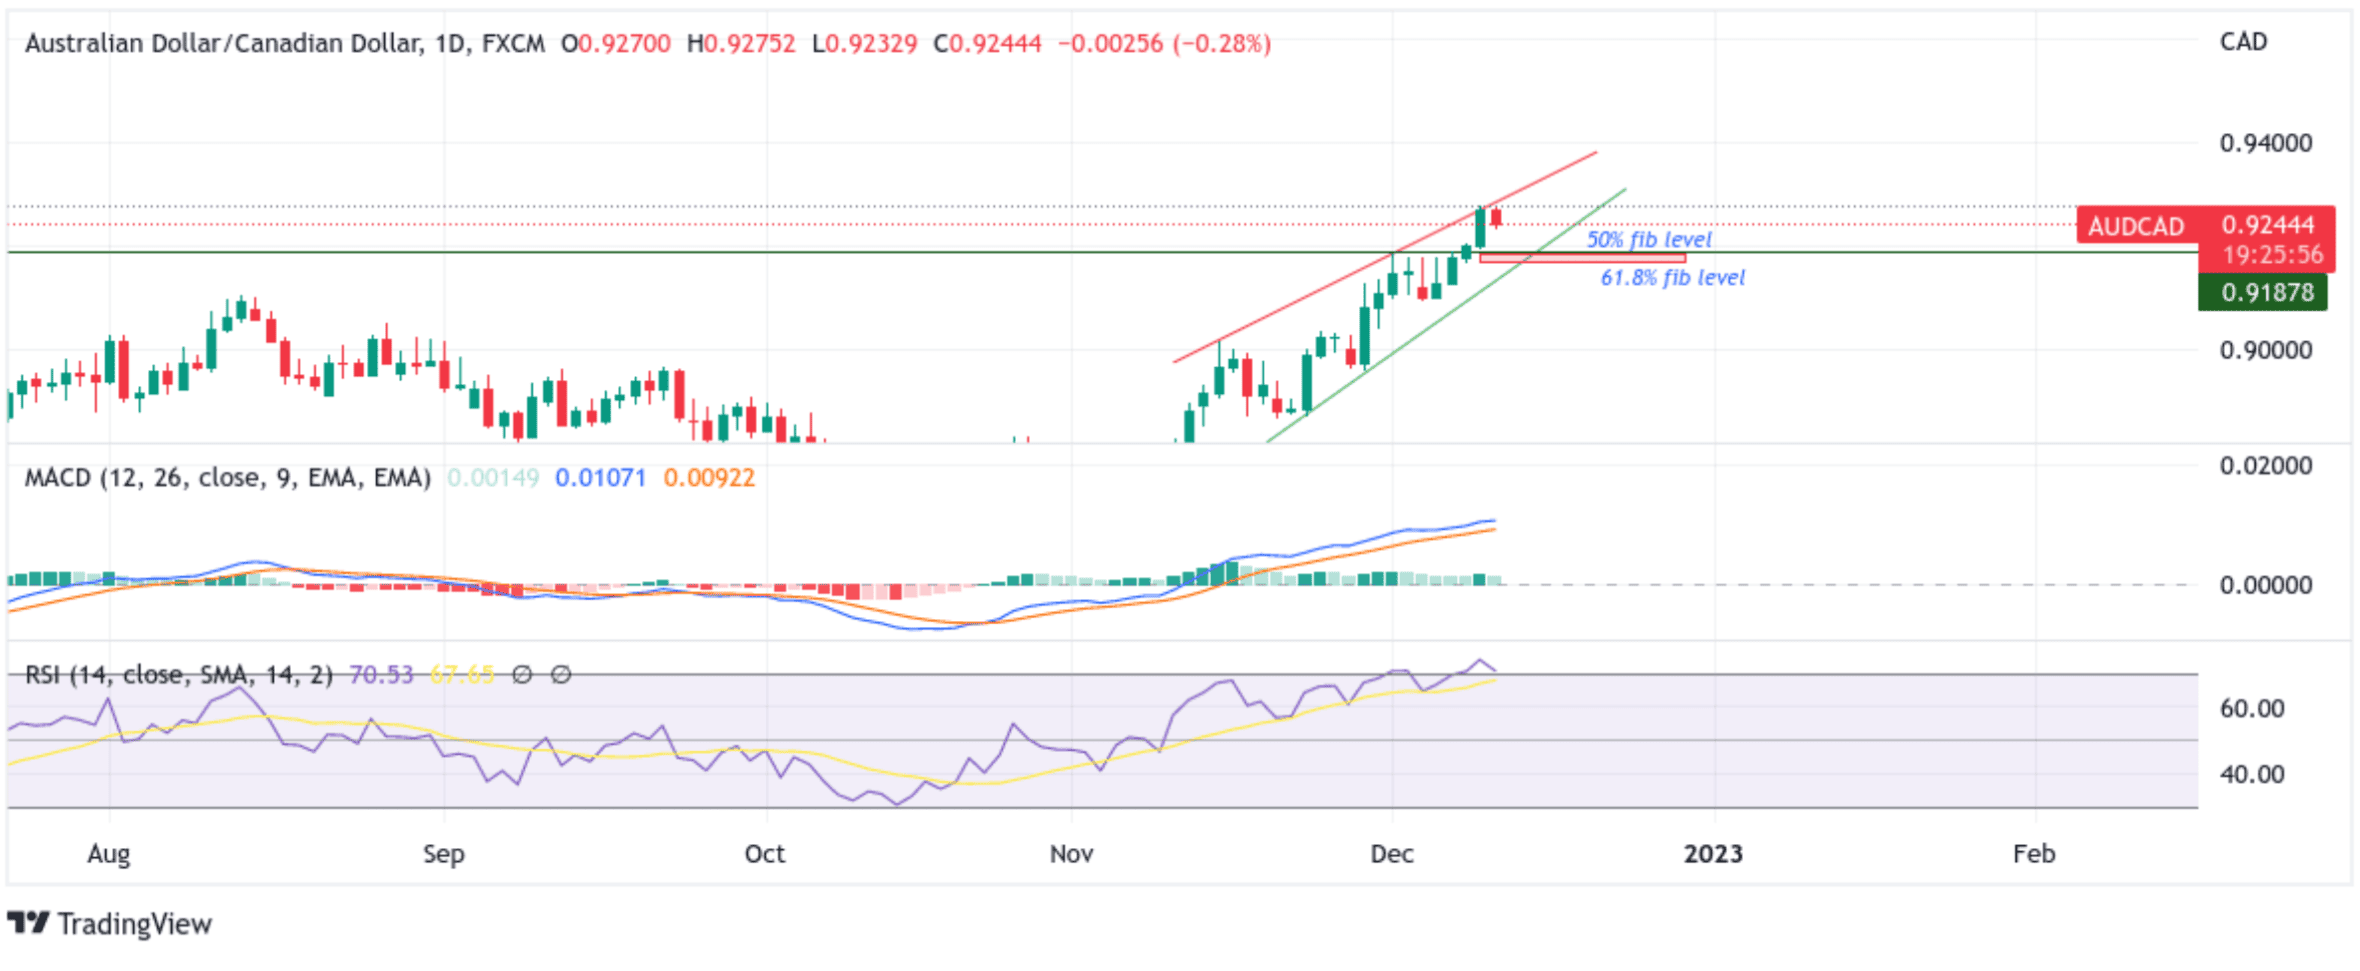
From a technical standstill using a one-day price chart, the price rebounded modestly from the vicinity of 0.92748 level after sensing a strong resistance level plotted by an upward ascending trendline of a rising wedge chart pattern plotted from 15th November higher-highs. Some follow-through selling (corrective move)would drag spot prices lower towards the 50% and 61.8 Fibonacci retracement levels at 0.91875 and 0.91646 levels, respectively (the former coincides with a key support level while the latter coincides with the downward descending trendline of the rising wedge chart pattern plotted from 23rd November higher-low). Sustained weakness below these floors would negate any near-term bullish outlook and pave the way for aggressive technical selling around the AUD/CAD pair.
All the technical oscillators on the daily chart are in positive territory, with the RSI (14) at 70.53, far above the signal line, and flashing overbought conditions, which warrant some caution ahead of this week's key events/data risks(traders should wait for sustained weakness below the 50% and 61.8 Fibonacci Retracement Levels before placing any further bearish bets. The Moving Average Convergence Divergence (MACD) Crossover is above the signal line, pointing to a bullish sign for price action this week (but a move below the signal line would trigger new sellers to enter the market and push down the price).
On the flip side, if dip-buyers and tactical traders jump back in and trigger a bullish reversal, initial resistance appears at the 0.92563 support level. If the price pierces this barrier, buying interest could gain momentum, creating the right conditions for an advance towards retesting the key resistance level (upward ascending trendline of a rising wedge chart pattern plotted from November 15th). A convincing break above this floor (bullish price breakout)would pave the way for an ascent toward the 0.93059 resistance level.